Fig. 1
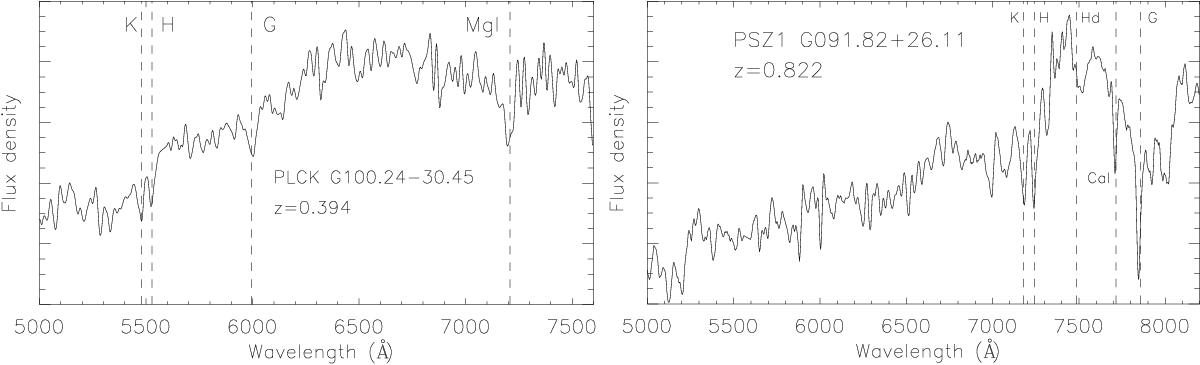
Two examples of spectra of early-type cluster members (previously selected as candidates in the photometric sample) obtained with the TNG/DOLORES (left panel) and GTC/OSIRIS (right panel). Dashed lines show the location of the main absoption features identified in the spectra. The vertical axes are given in arbitrary units.
Current usage metrics show cumulative count of Article Views (full-text article views including HTML views, PDF and ePub downloads, according to the available data) and Abstracts Views on Vision4Press platform.
Data correspond to usage on the plateform after 2015. The current usage metrics is available 48-96 hours after online publication and is updated daily on week days.
Initial download of the metrics may take a while.