| Issue |
A&A
Volume 585, January 2016
|
|
|---|---|---|
| Article Number | L5 | |
| Number of page(s) | 5 | |
| Section | Letters | |
| DOI | https://doi.org/10.1051/0004-6361/201527456 | |
| Published online | 07 January 2016 | |
2MASS J18082002−5104378: The brightest (V = 11.9) ultra metal-poor star ⋆
1 Universidade de São Paulo, IAG, Departamento de Astronomia, Rua do Matão 1226, Cidade Universitária, 05508-900 São Paulo, SP Brazil
e-mail: This email address is being protected from spambots. You need JavaScript enabled to view it.
2 University of Notre Dame, Department of Physics and JINA Center for the Evolution of the Elements, Notre Dame, IN 46556, USA
3 University of Texas at Austin, McDonald Observatory and Department of Astronomy, Austin, TX 78712, USA
4 Texas A&M University, Department of Physics and Astronomy, TX 77843, USA
5 Universidade de São Paulo, IAG, Departamento de Ciências Atmosféricas, Rua do Matão 1226, Cidade Universitária, 05508-900 São Paulo, SP, Brazil
Received: 27 September 2015
Accepted: 25 November 2015
Abstract
Context. The most primitive metal-poor stars are important for studying the conditions of the early galaxy and are also relevant to big bang nucleosynthesis.
Aims. Our objective is to find the brightest (V< 14) most metal-poor stars.
Methods. Candidates were selected using a new method, which is based on the mismatch between spectral types derived from colors and observed spectral types. They were observed first at low resolution with EFOSC2 at the NTT to obtain an initial set of stellar parameters. The most promising candidate, 2MASS J18082002−5104378 (V = 11.9), was observed at high resolution (R = 50 000) with UVES at the VLT, and a standard abundance analysis was performed.
Results. We found that 2MASS J18082002−5104378 is an ultra metal-poor star with stellar parameters Teff = 5440 K, log g = 3.0 dex, vt = 1.5 km s-1, [Fe/H] = −4.1 dex. The star has [C/Fe] < +0.9 in a 1D analysis, or [C/Fe] ≲ +0.5 if 3D effects are considered; its abundance pattern is typical of normal (non-CEMP) ultra metal-poor stars. Interestingly, the star has a binary companion.
Conclusions. 2MASS J1808−5104 is the brightest (V = 11.9) metal-poor star of its category, and it could be studied further with even higher S/N spectroscopy to determine additional chemical abundances, thus providing important constraints to the early chemical evolution of our Galaxy.
Key words: stars: abundances / stars: Population II / stars: individual: 2MASS J18082002-5104378
Based on observations obtained at the European Southern Observatory (ESO) Very Large Telescope (VLT, observing program 293.D-5036) and New Technology Telescope (NTT, observing programs 091.D-0292 and 092.D-0308).
© ESO, 2016
1. Introduction
The quest for the most metal-poor stars is one of the most active fields in astronomy. Efforts to discover metal-deficient stars have been in place for several decades. Previous surveys have found a number of them, which are important for studying the early stages of our Galaxy (e.g., Bond 1980; Bessell & Norris 1984; Beers et al. 1985, 1992; Cohen et al. 2004; Frebel et al. 2005, 2015; Fulbright et al. 2010; Placco et al. 2011; Caffau et al. 2011; Aoki et al. 2013; Yong et al. 2013; Keller et al. 2014).
The ultra metal-poor stars ([Fe/H] <−4, UMP) are key to studying the products ejected by the first massive stars (Population III) that polluted the early Galaxy (e.g., Frebel et al. 2015). At such low metallicities, the spectral lines are weak, therefore it is highly desirable to find relatively bright metal-poor stars, so that detailed abundance analyses can be performed.
Most of the previous and ongoing surveys focus on finding new faint metal-poor stars, but their faintness means that they are harder to observe at high spectral resolution. Nevertheless, some bright extremely metal-poor stars remain to be discovered, as shown by the bright V = 9.1) star BD+44°493, identified by Ito et al. (2009) as an extremely metal-poor star with [Fe/H] = − 3.7. This star is bright enough not only for high resolution optical spectroscopy but also for ultraviolet observations with the Hubble Space Telescope, as shown in a recent work by Placco et al. (2014a). Based on the lack of molecular absorption in the mid infrared, another recent work has identified a large number of bright (V< 14) metal-poor stars (Schlaufman & Casey 2014).
We have developed a new method that aims to find bright metal-poor stars with V< 14, in particular those with V< 12, for which high S/N high resolution spectra can be obtained in large telescopes. In this letter we report the first bright UMP star found in our survey, 2MASS J18082002−5104378 (hereafter 2MASS J1808−5104), a 11.9 mag star with [Fe/H] = − 4.07.
2. Sample selection and observations
Our metal-poor candidates were found using an ingenious new method. Metal-poor stars are usually misclassified in most spectral classification surveys, such as in the case of the two stars (HD 19445 and HD 140283) for which a significant metal deficiency was discovered for the first time by Chamberlain & Aller (1951). As noticed by the authors, these two stars are classified as A-type stars, but actually they were much cooler than stars of spectral type A. The reason for this mismatch was their low metal abundance, currently known to be [Fe/H] ~−2 (e.g., Korn et al. 2003; Zhang & Zhao 2005; Nissen et al. 2007; Ramírez et al. 2013).
We quantified the difference between the expected spectral type based on effective temperatures and their actual spectral classification using a sample of about 7000 stars for which effective temperatures (Teff), metallicities, and spectral classification are available in the updated catalog of stellar parameters described in Ramírez & Meléndez (2005a). Each spectral subclass was assigned a numeric spectral type ST: ST = 0 for M9, ST = 9 for a M0 star, and so on (ST = 10 for K9, etc.). For example, the difference between F0 (ST = 39) and G1 (ST = 28) is ΔST = 11. We calibrated ST with Teff for dwarf (ST = 52.65 ln (Teff)−429.0) and giant (ST = 42.10 ln (Teff)−336.4) stars, so that ST can be obtained based on Teff. As expected from their effective temperatures, we find that the most metal-poor stars have the largest difference (ΔST) between their observed spectral types.
We applied our technique to three large catalogs of spectral classifications (Nesterov et al. 1995; Wright et al. 2003; Skiff 2010). We cross-matched those three catalogs to APASS1 and 2MASS photometry (Cutri et al. 2003), finding 40 055, 195 495, and 145 441 matches, respectively. Using that photometry we estimated effective temperatures using color-Teff calibrations (Ramírez & Meléndez 2005b; Casagrande et al. 2010). We then selected stars with the largest differences (ΔST > 10) as the most promising metal-poor candidates. About two thousand metal-poor candidates were selected for follow-up medium-resolution spectroscopy. Most of them have 8.5 <V< 14.0, which is therefore adequate for an initial characterization of their stellar parameters with medium-resolution spectroscopy at small and medium-size telescopes and for follow up of the most interesting candidates using high S/N, high-resolution spectroscopy at medium-size and large telescopes.
Most medium-resolution spectra were acquired with the EFOSC2 spectrograph (grism #7) on the NTT telescope at the ESO La Silla Observatory. Additional medium-resolution spectra have been acquired with the 1.6-m telescope at the Observatorio Pico dos Dias in Brazil and with the 2.1-m Otto Struve telescope at the McDonald Observatory in the USA. The spectra were reduced with IRAF, following standard procedures (bias subtraction, flat fielding, sky subtraction, extraction of the spectrum, wavelength calibration).
The stellar parameters of the medium-resolution spectra were estimated using a modified version of the SEGUE Stellar Parameter Pipeline (e.g., Beers et al. 2014). The analysis revealed that 2MASS J1808−5104 was probably a subgiant with [Fe/H] ~−4, so we selected this star for high-resolution follow-up spectroscopy. Observations were acquired with the UVES spectrograph at the VLT telescope (program 293.D-5036) at a resolving power R = 50 000. We used the dichroic #1 with the cross disperser #2 in the blue (330–450 nm) and the cross disperser #3 in the red (480–680 nm). Three exposures of 1800 s were obtained adding to a total exposure time of 1 h 30 m. The high-resolution spectra were reduced using the UVES pipeline, and Doppler correction and continuum normalization were performed with IRAF. Figure 1 shows portions of the observed spectrum, compared with SDSS J1204+1201 ([Fe/H]= − 4.34, Teff = 5467 K; Placco et al. 2015a) and SDSS J1313−0019 ([Fe/H]= − 5.00, Teff = 5200 K; Frebel et al. 2015).
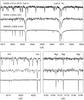 |
Fig. 1 Comparison of 2MASS J1808-5104 to other UMP stars (Placco et al. 2015a; Frebel et al. 2015). Both SDSS stars were observed with Magellan/MIKE, at a resolution of R ~ 35 000. Our UMP star was observed at R = 50 000 and has a higher S/N ratio than SDSS stars. |
The measured radial velocities are 70.4, 66.5, and –29.1 km s-1 (σ = 0.6 km s-1) in 19 October 2014, 21 October 2014 and 6 March 2015, respectively, showing that the star has a binary companion. No sign of the secondary is present in the spectra (whether on the blue or the red side), therefore we combined the individual spectra to achieve a S/N of about 150 per resolution element on the blue side and 300 on the red.
3. Analysis
The techniques applied to determine the stellar atmospheric parameters are described in detail in Placco et al. (2015b). Most of the work is based on equivalent widths (EW) measured by fitting Gaussian profiles to the observed atomic lines, using the Robospect package (Waters & Hollek 2013). The line lists used within Robospect were compiled from Roederer et al. (2012), the VALD database (Kupka et al. 1999), and the National Institute of Standards and Technology Atomic Spectra Database (NIST; Kramida et al. 2013). The model atmospheres are one-dimensional plane-parallel, no overshooting models computed in LTE from the grid of Castelli & Kurucz (2004).
For the stellar atmospheric parameter determination, as well as abundances from EW analysis and spectral synthesis, we used the latest version (2014) of the MOOG analysis package (Sneden 1973). The effective temperature was determined by imposing the excitation equilibrium of Fe I lines, and then we used the corrections described in Frebel et al. (2013) to bring the spectroscopic temperature into agreement with the photometric scale. The surface gravity was obtained by ionization equilibrium of Fe I and Fe II, and the microturbulence was estimated by enforcing no trend of Fe I abundances with reduced equivalent width. Our stellar parameters are Teff = 5440 ± 100 K, log g = 3.0 ± 0.2 dex, vt = 1.5 ± 0.2 km s-1, and [Fe/H] = −4.07 ± 0.07 dex.
Abundances for individual species.
Chemical abundances were derived from EW analysis for Na, Mg, Al, Si, Ca, Sc, Ti, Cr, Mn, Fe, Co, and Ni. From spectral synthesis, we were able to measure abundances for Li and Sr, and upper limits for C, N, and Ba. For Ba, the upper limit was determined from the 4934 Å feature, since the strong 4554 Å line fell in one of the gaps of the CCD. The elemental abundances and errors are shown in Table 1.
4. Discussion
With V = 11.9 and [Fe/H] = − 4.1, 2MASS J1808−5104 is the brightest UMP star (see Fig. 2). The star is slightly brighter than the giant UMP star CD−38 245 (V = 12.0), which has stellar parameters Teff = 4857 K, log g = 1.54, and [Fe/H] = − 4.15 dex (Yong et al. 2013).
The carbon abundance in a 1D analysis is [C/Fe] < +0.94 or +0.87, depending on the adopted solar carbon abundance (Asplund et al. 2009; Caffau et al. 2010). However, the CH lines are affected by strong 3D effects at low metallicity (e.g., Bonifacio et al. 2009). Although there are no predictions regarding the 3D effects for a star like 2MASS J1808−5104, interpolating on calculations for stars in the range of Teff = 4880–6550 K, log g = 2.0–4.5, and − 5 < [Fe/H] < −3 (Bonifacio et al. 2009; Caffau et al. 2012; Spite et al. 2013), the correction would be ΔC(3D–1D) ~ -0.4 dex, meaning that in 3D the carbon abundance would be [C/Fe] ≲ + 0.5.
According to Aoki et al. (2007), a carbon-enhanced metal-poor star (CEMP) has [C/Fe] > +0.7. However, we notice that this suggestion was mostly based on stars with [Fe/H] > −3.5, and as the [C/Fe] ratio seems to increase at lower metallicities, perhaps this definition should be revised. Beers & Christlieb (2005) define CEMP stars as those with [C/Fe] > +1.0, a definition also adopted by Spite et al. (2013). If the normal (non-CEMP) stars indeed have higher [C/Fe] at lower metallicities (see, e.g., Fig. 13 in Placco et al. 2014b), perhaps a metallicity-dependent definition of CEMP should be considered. In any case, the 3D-corrected value of [C/Fe] ≲+0.5, surely puts 2MASS J1808−5104 in the category of non-CEMP star.
At the metallicity and log g( = 3.0 ± 0.2) of our UMP star, it should be either leaving the subgiant branch or entering the bottom of the red giant branch (RGB), because it is less evolved than the giant (log g = 1.5) CD−38 245. This is important for the study of the light elements (C, N, O), since 2MASS J1808−5104 should be much less affected by mixing than CD−38 245. According to observations and calculations (including extra-mixing) for field and globular cluster giants (Gratton et al. 2000; Denissenkov & VandenBerg 2003; Denissenkov et al. 2015; Stancliffe et al. 2009; Shetrone et al. 2010; Angelou et al. 2011), during the first dredge-up (starting at MV ~ 2.0, log g ~ 3.0, log L/L⊙ ~ 1.2), there should only be a minor depletion of carbon (ΔC < 0.1 dex). Only when the star reaches the RGB bump (MV ~ −0.2, log g ~ 2.0, log L/L⊙ ~ 2.1) does a steep carbon depletion begin (ΔC ≫ 0.1 dex).
Because CD−38 245 is above the RGB bump, it should have already experienced deep mixing. Indeed, only an upper limit is available for its carbon abundance (see, e.g., Spite et al. 2005). This upper limit in C and its N abundance place CD−38 245 among the mixed stars of the sample of metal-poor giants of Spite et al. (2005). With higher S/N data, we can try to measure the C and N abundances in 2MASS J1808−5104, so as to have a measurement of the abundances of those elements in the primeval Galaxy.
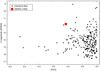 |
Fig. 2 V magnitudes for metal-poor stars with [Fe/H] ≤−3. 2MASS J1808−5104 is the brightest UMP ([Fe/H] < –4). The literature data are from the compilation presented in Placco et al. (2014b). |
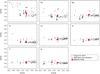 |
Fig. 3 Chemical abundances of 2MASS J1808−5104 compared to metal-poor stars with [Fe/H] ≤−3 from Yong et al. (2013) and UMP from the compilation by Placco et al. (2015a). |
In Fig. 3 the abundance pattern of 2MASS J1808−5104 is compared to the sample of Yong et al. (2013) and UMP stars from the literature, as compiled by Placco et al. (2015a). The [X/Fe] ratios match other UMP stars, and also fits the extension of the Yong et al. (2013) pattern to the UMP regime.
The lithium abundance, A(Li) = 1.45 dex, places 2MASS J1808−5104 in the group of “unmixed” (meaning without deep mixing) stars of Spite et al. (2005), thus confirming that 2MASS J1808−5104 is key to studying the light elements, since its abundances should reflect the “pristine” values of the time that the star was formed. For the neutron-capture elements, we were only able to determine an abundance for Sr, A(Sr) = − 2.03, and an upper limit for Ba, A(Ba) <−2.20. These values are consistent with the “abundance floors” suggested by Hansen et al. (2015) for UMP stars.
As a non-CEMP, very metal-deficient star ([Fe/H] = −4.1), 2MASS J1808−5104 is important for understanding the percentage of CEMP stars at low metallicity (Placco et al. 2014b) and the channels that can form CEMP-no stars at such extreme metallicities (e.g., Cooke & Madau 2014). Perhaps this could be related to the binarity of 2MASS J1808−5104, because population III stars have a channel of low-mass binary formation (Stacy & Bromm 2014).
Although 2MASS J1808−5104 is a binary, the light elements are not enhanced. This star has an abundance pattern typical of other non-CEMP stars. This is consistent with mass transfer without significant enhancement of the light elements, according to binary population synthesis (Suda et al. 2013).
5. Conclusions
Our new technique, which is based on the mismatch between the expected spectral type derived from the effective temperature of a star and its actual spectral classification, can successfully identify metal-poor stars. We have identified 2MASS J1808−5104 as the brightest (V = 11.9) UMP star ([Fe/H] <−4).
Variations in the radial velocities of this star, show that it belongs to a binary system, but the spectrum of the secondary was not detected. The star has [C/Fe] ≲ + 0.9 in a 1D analysis or [C/Fe] ≲ + 0.5 if 3D effects are considered, making it a non-CEMP star. The abundance pattern is also typical of non-CEMP stars. The star seems to be leaving the subgiant branch or entering the bottom of the RGB, making it useful for studying the abundances of the light elements because the star should not have experienced any deep mixing yet.
We intend to perform higher S/N observations to detect C (from CH) and nitrogen (from NH). Also, we would like to increase our ultraviolet coverage, in order to reach other elements, such as oxygen (from OH) and heavy elements. Our new observations will also provide valuable information on radial velocities, so that we can characterize the binary system.
Acknowledgments
J.M. acknowledges support from FAPESP (2012/24392-2, 2010/50930-6) and CNPq (Bolsa de Produtividade). V.M.P. acknowledges partial support for this work from PHY 08-22648; Physics Frontier Center/Joint Institute for Nuclear Astrophysics (JINA) and PHY 14-30152; Physics Frontier Center/JINA Center for the Evolution of the Elements (JINA-CEE), awarded by the US National Science Foundation.
References
- Angelou, G. C., Church, R. P., Stancliffe, R. J., Lattanzio, J. C., & Smith, G. H. 2011, ApJ, 728, 79 [NASA ADS] [CrossRef] [Google Scholar]
- Aoki, W., Beers, T. C., Christlieb, N., et al. 2007, ApJ, 655, 492 [NASA ADS] [CrossRef] [Google Scholar]
- Aoki, W., Beers, T. C., Lee, Y. S., et al. 2013, AJ, 145, 13 [NASA ADS] [CrossRef] [Google Scholar]
- Asplund, M., Grevesse, N., Sauval, A. J., & Scott, P. 2009, ARA&A, 47, 481 [NASA ADS] [CrossRef] [Google Scholar]
- Beers, T. C., & Christlieb, N. 2005, ARA&A, 43, 531 [NASA ADS] [CrossRef] [Google Scholar]
- Beers, T. C., Preston, G. W., & Shectman, S. A. 1985, AJ, 90, 2089 [NASA ADS] [CrossRef] [Google Scholar]
- Beers, T. C., Preston, G. W., & Shectman, S. A. 1992, AJ, 103, 1987 [NASA ADS] [CrossRef] [Google Scholar]
- Beers, T. C., Norris, J. E., Placco, V. M., et al. 2014, ApJ, 794, 58 [NASA ADS] [CrossRef] [Google Scholar]
- Bessell, M. S., & Norris, J. 1984, ApJ, 285, 622 [NASA ADS] [CrossRef] [Google Scholar]
- Bond, H. E. 1980, ApJS, 44, 517 [NASA ADS] [CrossRef] [Google Scholar]
- Bonifacio, P., Spite, M., Cayrel, R., et al. 2009, A&A, 501, 519 [NASA ADS] [CrossRef] [EDP Sciences] [Google Scholar]
- Caffau, E., Ludwig, H.-G., Bonifacio, P., et al. 2010, A&A, 514, A92 [NASA ADS] [CrossRef] [EDP Sciences] [Google Scholar]
- Caffau, E., Bonifacio, P., François, P., et al. 2011, Nature, 477, 67 [NASA ADS] [CrossRef] [PubMed] [Google Scholar]
- Caffau, E., Bonifacio, P., François, P., et al. 2012, A&A, 542, A51 [NASA ADS] [CrossRef] [EDP Sciences] [Google Scholar]
- Casagrande, L., Ramírez, I., Meléndez, J., Bessell, M., & Asplund, M. 2010, A&A, 512, A54 [NASA ADS] [CrossRef] [EDP Sciences] [Google Scholar]
- Castelli, F., & Kurucz, R. L. 2004, ArXiv e-prints [arXiv:astro-ph/0405087] [Google Scholar]
- Chamberlain, J. W., & Aller, L. H. 1951, ApJ, 114, 52 [NASA ADS] [CrossRef] [Google Scholar]
- Cohen, J. G., Christlieb, N., McWilliam, A., et al. 2004, ApJ, 612, 1107 [NASA ADS] [CrossRef] [Google Scholar]
- Cooke, R. J., & Madau, P. 2014, ApJ, 791, 116 [NASA ADS] [CrossRef] [Google Scholar]
- Cutri, R. M., Skrutskie, M. F., van Dyk, S., et al. 2003, VizieR Online Data Catalog: II/246 [Google Scholar]
- Denissenkov, P. A., & VandenBerg, D. A. 2003, ApJ, 593, 509 [NASA ADS] [CrossRef] [Google Scholar]
- Denissenkov, P. A., VandenBerg, D. A., Hartwick, F. D. A., et al. 2015, MNRAS, 448, 3314 [NASA ADS] [CrossRef] [Google Scholar]
- Keller, S. C., Bessell, M. S., Frebel, A., et al. 2014, Nature, 506, 463 [NASA ADS] [CrossRef] [PubMed] [Google Scholar]
- Frebel, A., Aoki, W., Christlieb, N., et al. 2005, Nature, 434, 871 [NASA ADS] [CrossRef] [PubMed] [Google Scholar]
- Frebel, A., Casey, A. R., Jacobson, H. R., & Yu, Q. 2013, ApJ, 769, 57 [NASA ADS] [CrossRef] [Google Scholar]
- Frebel, A., Simon, J. D., & Kirby, E. N. 2014, ApJ, 786, 74 [NASA ADS] [CrossRef] [Google Scholar]
- Frebel, A., Chiti, A., Ji, A. P., Jacobson, H. R., & Placco, V. M. 2015, ApJ, 810, L27 [NASA ADS] [CrossRef] [Google Scholar]
- Fulbright, J. P., Wyse, R. F. G., Ruchti, G. R., et al. 2010, ApJ, 724, L104 [NASA ADS] [CrossRef] [Google Scholar]
- Gratton, R. G., Sneden, C., Carretta, E., & Bragaglia, A. 2000, A&A, 354, 169 [NASA ADS] [Google Scholar]
- Hansen, T., Hansen, C. J., Christlieb, N., et al. 2015, ApJ, 807, 173 [NASA ADS] [CrossRef] [Google Scholar]
- Ito, H., Aoki, W., Honda, S., & Beers, T. C. 2009, ApJ, 698, L37 [NASA ADS] [CrossRef] [Google Scholar]
- Korn, A. J., Shi, J., & Gehren, T. 2003, A&A, 407, 691 [NASA ADS] [CrossRef] [EDP Sciences] [Google Scholar]
- Kramida, A., Yu. Ralchenko, Reader, J., & and NIST ASD Team. 2013, NIST Atomic Spectra Database (ver. 5.1), [Online] available: http://physics.nist.gov/asd (2014, April 7) (Gaithersburg, MD: National Institute of Standards and Technology) [Google Scholar]
- Kupka, F., Piskunov, N., Ryabchikova, T. A., Stempels, H. C., & Weiss, W. W. 1999, A&AS, 138, 119 [NASA ADS] [CrossRef] [EDP Sciences] [MathSciNet] [PubMed] [Google Scholar]
- Nesterov, V. V., Kuzmin, A. V., Ashimbaeva, N. T., et al. 1995, A&AS, 110, 367 [NASA ADS] [Google Scholar]
- Nissen, P. E., Akerman, C., Asplund, M., et al. 2007, A&A, 469, 319 [NASA ADS] [CrossRef] [EDP Sciences] [Google Scholar]
- Placco, V. M., Kennedy, C. R., Beers, T. C., et al. 2011, AJ, 142, 188 [NASA ADS] [CrossRef] [Google Scholar]
- Placco, V. M., Beers, T. C., Roederer, I. U., et al. 2014a, ApJ, 790, 34 [NASA ADS] [CrossRef] [Google Scholar]
- Placco, V. M., Frebel, A., Beers, T. C., & Stancliffe, R. J. 2014b, ApJ, 797, 21 [NASA ADS] [CrossRef] [Google Scholar]
- Placco, V. M., Frebel, A., Lee, Y. S., et al. 2015a, ApJ, 809, 136 [NASA ADS] [CrossRef] [Google Scholar]
- Placco, V. M., Beers, T. C., Ivans, I. I., et al. 2015b, ApJ, 812, 109 [NASA ADS] [CrossRef] [Google Scholar]
- Ramírez, I., & Meléndez, J. 2005a, ApJ, 626, 446 [NASA ADS] [CrossRef] [MathSciNet] [Google Scholar]
- Ramírez, I., & Meléndez, J. 2005b, ApJ, 626, 465 [NASA ADS] [CrossRef] [Google Scholar]
- Ramírez, I., Allen de Prieto, C., & Lambert, D. L. 2013, ApJ, 764, 78 [NASA ADS] [CrossRef] [Google Scholar]
- Roederer, I. U., Lawler, J. E., Sobeck, J. S., et al. 2012, ApJS, 203, 27 [NASA ADS] [CrossRef] [Google Scholar]
- Schlaufman, K. C., & Casey, A. R. 2014, ApJ, 797, 13 [NASA ADS] [CrossRef] [Google Scholar]
- Shetrone, M., Martell, S. L., Wilkerson, R., et al. 2010, AJ, 140, 1119 [NASA ADS] [CrossRef] [Google Scholar]
- Skiff, B. A. 2010, VizieR Online Data Catalog, 1, 2023 [Google Scholar]
- Sneden, C. A. 1973, Ph.D. Thesis, 35, 0028 [Google Scholar]
- Spite, M., Cayrel, R., Plez, B., et al. 2005, A&A, 430, 655 [NASA ADS] [CrossRef] [EDP Sciences] [Google Scholar]
- Spite, M., Caffau, E., Bonifacio, P., et al. 2013, A&A, 552, A107 [NASA ADS] [CrossRef] [EDP Sciences] [Google Scholar]
- Stacy, A., & Bromm, V. 2014, ApJ, 785, 73 [NASA ADS] [CrossRef] [Google Scholar]
- Stancliffe, R. J., Church, R. P., Angelou, G. C., & Lattanzio, J. C. 2009, MNRAS, 396, 2313 [Google Scholar]
- Suda, T., Komiya, Y., Yamada, S., et al. 2013, MNRAS, 432, L46 [NASA ADS] [CrossRef] [Google Scholar]
- Waters, C. Z., & Hollek, J. K. 2013, PASP, 125, 1164 [NASA ADS] [CrossRef] [Google Scholar]
- Wright, C. O., Egan, M. P., Kraemer, K. E., & Price, S. D. 2003, AJ, 125, 359 [NASA ADS] [CrossRef] [Google Scholar]
- Yong, D., Norris, J. E., Bessell, M. S., et al. 2013, ApJ, 762, 26 [NASA ADS] [CrossRef] [Google Scholar]
- Zhang, H. W., & Zhao, G. 2005, MNRAS, 364, 712 [NASA ADS] [Google Scholar]
All Tables
All Figures
|
Fig. 1 Comparison of 2MASS J1808-5104 to other UMP stars (Placco et al. 2015a; Frebel et al. 2015). Both SDSS stars were observed with Magellan/MIKE, at a resolution of R ~ 35 000. Our UMP star was observed at R = 50 000 and has a higher S/N ratio than SDSS stars. |
| In the text | |
|
Fig. 2 V magnitudes for metal-poor stars with [Fe/H] ≤−3. 2MASS J1808−5104 is the brightest UMP ([Fe/H] < –4). The literature data are from the compilation presented in Placco et al. (2014b). |
| In the text | |
|
Fig. 3 Chemical abundances of 2MASS J1808−5104 compared to metal-poor stars with [Fe/H] ≤−3 from Yong et al. (2013) and UMP from the compilation by Placco et al. (2015a). |
| In the text | |
Current usage metrics show cumulative count of Article Views (full-text article views including HTML views, PDF and ePub downloads, according to the available data) and Abstracts Views on Vision4Press platform.
Data correspond to usage on the plateform after 2015. The current usage metrics is available 48-96 hours after online publication and is updated daily on week days.
Initial download of the metrics may take a while.