| Issue |
A&A
Volume 585, January 2016
|
|
|---|---|---|
| Article Number | A18 | |
| Number of page(s) | 16 | |
| Section | Extragalactic astronomy | |
| DOI | https://doi.org/10.1051/0004-6361/201526820 | |
| Published online | 09 December 2015 | |
The peculiar optical-UV X-ray spectra of the X-ray weak quasar PG 0043+039⋆
1 Institut für Astrophysik, Universität Göttingen Friedrich-Hund Platz 1 37077 Göttingen Germany
e-mail:
wkollat@astro.physik.uni-goettingen.de
2 XMM-Newton Science Operations Centre, ESA, Villafranca del Castillo, Apartado 78, 28691 Villanueva de la Cañada, Spain
3 Osservatorio Astronomico di Brera (INAF), via Brera 28, 20121 Milano, Italy
Received: 23 June 2015
Accepted: 25 September 2015
Context. The object PG 0043+039 has been identified as a broad absorption line (BAL) quasar based on its UV spectra. However, this optical luminous quasar has not been detected before in deep X-ray observations, making it the most extreme X-ray weak quasar known today.
Aims. This study aims to detect PG 0043+039 in a deep X-ray exposure. The question is what causes the extreme X-ray weakness of PG 0043+039? Does PG 0043+039 show other spectral or continuum peculiarities?
Methods. We took simultaneous deep X-ray spectra with XMM-Newton, far-ultraviolet (FUV) spectra with the Hubble Space Telescope (HST), and optical spectra of PG 0043+039 with the Hobby-Eberly Telescope (HET) and Southern African Large Telescope (SALT) in July, 2013.
Results. We have detected PG 0043+039 in our X-ray exposure taken in 2013. We presented our first results in a separate paper (Kollatschny et al. 2015). PG 0043+039 shows an extreme αox gradient (αox = −2.37). Furthermore, we were able to verify an X-ray flux of this source in a reanalysis of the X-ray data taken in 2005. At that time, it was fainter by a factor of 3.8 ±0.9 with αox = −2.55. The X-ray spectrum is compatible with a normal quasar power-law spectrum (Γ = 1.70-0.45+0.57) with moderate intrinsic absorption (NH = 5.5-3.9+6.9 × 1021 cm-2) and reflection. The UV/optical flux of PG 0043+039 has increased by a factor of 1.8 compared to spectra taken in the years 1990-1991. The FUV spectrum is highly peculiar and dominated by broad bumps besides Lyα. There is no detectable Lyman edge associated with the BAL absorbing gas seen in the CIV line. PG 0043+039 shows a maximum in the overall continuum flux at around λ ≈ 2500 Å in contrast to most other AGN where the maximum is found at shorter wavelengths. All the above is compatible with an intrinsically X-ray weak quasar, rather than an absorbed X-ray emission. Besides strong FeII multiplets and broad Balmer and HeI lines in the optical band we only detect a narrow [O ii]λ3727 emission line and a BAL system in the CaH λ3968, CaK λ3934 lines (blueshifted by 4900 km s-1) and in the He i λ3889 line (blueshifted by 5600 km s-1).
Key words: galaxies: active / quasars: individual: PG0043+039 / X-rays: galaxies / ultraviolet: galaxies
© ESO, 2015
1. Introduction
PG 0043+039 is a bright (mv ~ 15.5) and luminous quasar (MB = −26.11) at a redshift of z = 0.38512. A luminosity of νLν = 2.21 × 1044 erg s-1 at 3000 Å has been determined before for this quasar (Baskin & Laor 2004). This corresponds to an Eddington luminosity log L/Ledd = −0.648 for a black hole mass of M = 8.9 × 10⁹M⊙ (Baskin & Laor 2005). A first optical spectrum of PG 0043+039 taken in Sept. 1990 has been published by Boroson & Green (1992). PG 0043+039 has been identified by Bahcall et al. (1993) and Turnshek et al. (1994; 1997) as a weak broad absorption line (BAL) quasar based on CIV BAL detected with the Hubble Space Telescope (HST). Bechtold et al. (2002) describe the CIV absorber in a reanalysis of the HST Faint Object Spectrograph (FOS) spectra as a very narrow associated absorber. PG 0043+039 shows strong Fe II blends in the optical. No narrow [OIII], [OII] lines have been detected by Turnshek et al. (1994) before. The observed continuum in the UV is atypical in the sense that it is much weaker relative to the optical continuum compared to normal quasars. There is no evidence for a BAL caused by low-ionization transitions of, for example, AlII or CII.
A ROSAT nondetection established PG 0043+039 as an X-ray weak quasar (Brandt et al. 2000). It was not detected in pointed observations with the ASCA satellite in the year 1996 (Gallagher et al. 1999). Furthermore, PG 0043+039 is the only quasar in the PG sample (Schmidt & Green, 1983), which was not detected in a dedicated XMM-Newton pointing (Czerny et al. 2008).
PG 0043+039 is the most extreme X-ray weak quasar known to date, but surprisingly only shows a weak BAL system. The majority of BAL quasars are X-ray weak because of a shielding gas (following Murray et al. 1995) or an intrinsic X-ray weakness that produces more preferable conditions for wind launching and driving (e.g., Baskin et al. 2013). A conclusive interpretation about the X-ray weakness in PG 0043+039 was hampered by the absence of simultaneous measurements, which is mandatory as both the X-ray flux and the BAL system are known to be variable.
There is the possibility that the X-ray quietness of PG 0043+039 was only a temporal event or that it was a false conclusion driven by spectra that were not taken simultaneously in the optical/UV and X-ray bands. Fluctuations in the accretion process may have caused a short interruption or huge drop in the X-ray emission as seen in several low state observations. Examples of the latter are PG2112+059 (Schartel et al. 2010) and 1H0707-495 (Fabian et al. 2011). The source spectroscopic type can change with time. This was, for example, observed for Fairall 9 (Sey 1 to Sey 2; Kollatschny et al. 1985) or NGC 2617 (Sey 1.8 to Sey 1; Shappee et al. 2014). The X-ray spectral characteristics can change with time because of changes in the column density and/or the ionization state of the X-ray absorbing material. Examples are NGC 1365 (Risaliti et al. 2005) and NGC 7583 (Bianchi et al. 2009). BAL systems may develop with time as reported for WPVS 007 (Leighly et al. 2009), where the change in the broad UV absorption system was reflected in changes of the X-ray brightness interpreted as due to both X-ray absorption and X-ray weakness. Here we want to verify that the X-ray weakness in PG 0043+039 was not only a temporal event and was not only caused by strong X-ray variations and or optical/UV variations in this BAL quasar. In a first paper (Kollatschny et al. 2015, hereafter called Paper I) we briefly presented our X-ray detection. Furthermore, we discussed newly detected strong, broad humps seen in the UV spectrum of PG 0043+039 taken with the HST. We attributed these humps to cyclotron lines.
2. Observations
We took simultaneous X-ray, UV, and optical spectra of PG 0043+039 in July 2013:
2.1. XMM-Newton observations
PG 0043+039 was observed twice with XMM-Newton (Jansen et al. 2001). The first observation (Obs1 in the following) was performed on the 15.6.2005 under ObsId. 0300890101. This observation was free of any periods of high background radiation implying exposure times of 26.6 ks for pn (Strüder et al. 2001), 31.2 ks for MOS 1 (Turner et al. 2001), and 31.1 ks for MOS 2. The second observation (Obs2) was performed on the 18.7.2013 under ObsId. 0690830201. This observation was affected by high background radiation periods. The data were processed with SAS 14.0.0 in January 2015, using the latest calibration and following the methods described in Schartel et al. (2007) and Piconcelli et al. (2005). All effective areas were calculated applying the method corrarea, which empirically corrects the EPIC effective areas for the instrumental differences. We screened for low background periods: For the energy range from 0.2 keV to 12 keV, we extracted the counts that were registered within an annulus centered at the optical position of PG 0043+039 with an inner radius of 1 arcmin and an outer radius of 11 arcmin for pn (14 arcmin for the MOSs). To generate a light curve we binned the counts with 100 s. We defined low background times as time intervals with a count rate below 6 c/s for pn and 4 c/s for MOSs. We obtained a clean exposure time of 14.5 ks for pn, 29.0 ks for MOS1, and 31.3 ks for MOS2. For each modeling of the X-ray spectra, we assumed Galactic foreground absorption with an column density of NH = 3.0 × 1020 cm-2 (Savage et al. 1993).
During Obs1 several observations were performed with the OM (Mason et al. 2001). We took the source fluxes and their errors for the image observations with different filters from the second release of the XMM OM Serendipitous Ultraviolet Source Survey catalog (XMM-SUSS2). The description of the first release of the catalog can be found in Page et al. (2012). The spectrum from OM V-grism was manually extracted using omgsource, to avoid the close-by spectrum of a star that contaminates the background of the target spectrum in the automatic extraction by SAS. During Obs2 OM could not operate as PG 0043+039 was too close to Uranus to enable safe operation of the instrument.
2.2. HST-COS FUV spectroscopy
We observed the BAL PG 0043+039 over one full HST orbit at RA, Dec (J2000) = 00:45:47.230, +04:10:23.40 with an exposure time of 1552 seconds on July 18 2013. We used the far-ultraviolet (FUV) detector of the Cosmic Origins Spectrograph (COS) with the G140L grating and an 2.5 arcsec aperture (circular diameter). This spectral set covers the wavelength range from ~1140 Å to ~2150 Å with a resolving power of 2000 at 1500 Å. To fill up the wavelength hole produced by the chip gap and to reduce the fixed pattern noise, we split our observation into four separate segments of 388 s duration at two different FP-POS offset positions and four different central wavelengths. The observed spectrum corresponds to ~800 Å to ~1550 Å in the rest frame of the galaxy. The original data were processed using the standard CALCOS calibration pipeline. We corrected this UV spectrum, as well as our optical spectra of PG 0043+039, for Galactic extinction. We used the reddening value E(B−V) = 0.02087 deduced from the Schlafly & Finkbeiner (2011) recalibration of the Schlegel et al. (1998) infrared-based dust map. The reddening law of Fitzpatrick (1999) with RV = 3.1 was applied to our UV/optical spectra.
2.3. Ground-based optical spectroscopy with the SALT and HET telescopes
We took one optical spectrum of PG 0043+039 with the 10m Southern African Large Telescope (SALT) nearly simultaneously with the XMM/HST observations on July 21, 2013 under photometric conditions. However, the moon was bright during this observation. The spectrum was taken with the Robert Stobie Spectrograph (RSS; see Burgh et al. 2003) attached to the telescope using the pg0900 grating with a 1.5 arcsec wide slit. With a grating angle of 21.125 degrees, we covered the wavelength range from 6445 to 9400 Å at a spectral resolution of 4.8 Å (FWHM) and a reciprocal dispersion of 0.97 Åpixel-1. The observed wavelength range corresponds to a wavelength range from 4653 to 6786 Å in the rest frame of the galaxy. There are two gaps in the spectrum caused by the gaps between the three CCDs: one between the blue and the central CCD chip as well as one between the central and red CCD chip, covering the wavelength ranges 7425−7480 Å and 8438−8491 Å (5360−5400 Å and 6092−6130 Å in the rest frame). The exposure time of our spectrum was 2200 s (37 min), which yielded a signal-to-noise ratio (S/N) of 118 at 7020 ± 10 Å in the observed frame.
In addition to the galaxy spectrum, necessary flat-field and Xe arc frames were observed, as well as spectrophotometric standard stars for flux calibration (Hiltner 600, LTT4363). The spectrophotometric standard stars were used to correct the measured counts for the combined transmission of the instrument, telescope, and atmosphere as a function of wavelength. Flat-field frames were used to correct for differences in sensitivity both between detector pixels and across the field. The bright moon caused fringes in the red CCD at around 9000 Å.
We took a second optical spectrum of PG 0043+039 with the 9.2 m Hobby-Eberly Telescope (HET) at McDonald Observatory on August 1, 2013 under nearly photometric conditions. The spectrum was taken with the Marcario Low Resolution Spectrograph (LRS) mounted at the prime focus of HET. The detector was a 3072 × 1024 15 μm pixel Ford Aerospace CCD with 2 × 2 binning. This spectrum covers the wavelength range from 4390 Å to 7275 Å (LRS grism 2 configuration) with a resolving power of 650 at 5000 Å (8.2 Å FWHM). This wavelength range corresponds to 3170 to 5250 Å in the rest frame of the galaxy. The spectrum was taken with an exposure time of 1500 seconds (25 min), which yielded a S/N of 102 at 5120 ± 10 Å and of 83 at 7020 ± 10 Å. The slit width was 2.̋0 projected on the sky. We took Xe spectra to enable the wavelength calibration. A spectrum of the standard star BD40 was observed for flux calibration as well.
Our SALT spectrum has a spatial resolution of 0.̋2534 per binned pixel. We extracted eleven columns from each of our object spectra corresponding to 2.̋8. Our HET spectrum has a spatial resolution of 0.̋472 per binned pixel. Here we extracted seven columns for our object spectrum corresponding to 3.̋3.
The reduction of the spectra (bias subtraction, cosmic ray correction, flat-field correction, 2D-wavelength calibration, night sky subtraction, and flux calibration) was performed in a homogeneous way with IRAF reduction packages (e.g., Kollatschny et al. 2001). We corrected the optical spectra for atmospheric absorption bands as well. All wavelengths were converted to the rest frame of the galaxy (z = 0.38512).
3. Results
Here we present the results of our observing campaign based on the obtained spectral data in the X-ray, UV, and optical frequency bands.
3.1. X-ray flux in PG 0043+039
Visual inspection of the EPIC images of Obs1 does not reveal an X-ray counterpart for PG 0043+039 and Czerny et al. (2008) derived an upper limit for the source flux of <8.6 × 10⁻¹⁶ erg s-1 cm-2 for the 0.1 to 2.4 keV energy range. The nearest X-ray source to PG 0043+039 is 3XMM J004548.8+041018 (Watson et al. 2009) at a distance of 24.06 arcsec. In 3XMM-DR5 the source has a EPIC (CR(pn) and CR(MOS1) and CR(MOS2)) count rate of 1.92 ± 0.10 × 10⁻² counts s-1 in the 0.2 to 12. keV energy range and is most likely the counterpart to SDSS-DR8 J004548.80+041019.0. In order to check for weakest X-ray signal of PG 0043+039, we reanalyzed all three EPIC exposures together. We extracted the possible source counts in a circle centered at the optical position of PG 0043+039 with a radius of 10 arcsec for pn and 12 arcsec of MOS and we extracted the background counts from a circle centered at 0:45:43.62 +4:10:00.95 with a radius of 34 arcsec. The background area is source free and located at the same CCD. The combined analysis leads to a weak signal with a total EPIC pn+MOS count rate of 3.7 ± 1.1 × 10⁻⁴ counts s-1 for the 0.3 to 12.0 keV energy range. We performed the same analysis for three control positions (0:45:48.15 +4:10:41.79, 0:45:49.73 +4:10:40.53, and 0:45:50.53 +4:10:20.74). Each position shows a distance of 24 arcsec to 3XMM J004548.8+041018 and is located at the same CCD as PG 0043+039. We obtained the following count rates: 0.43 ± 9.42 × 10⁻⁵ counts s-1, 0.70 ± 9.00 × 10⁻⁵ counts s-1, and −0.92 ± 9.19 × 10⁻⁵ counts s-1. The obtained count rates of the control positions are significantly lower than the signal obtained for the optical position of PG 0043+039. The obtained signal cannot be explained with the short distance to 3XMM J004548.8+041018 and we conclude that the combined analysis of all there EPIC cameras reveal a weak X-ray signal from PG 0043+039
3XMM J004548.8+041018 is present in the Obs2, too, but the source shows a significantly decreased flux with an Epic count rate of 4.19 ± 0.73 × 10⁻⁵ counts s-1 for the 0.2 to 12 keV region. PG 0043+039 is clearly visible as point source in the images of all there exposures. We extracted source counts exactly as described for Obs1 above except that we centered the circle at the eye-determined center of the X-ray emission (0:45:47.07 +4:10:23.50) and obtained a count rate of 1.42 ± 0.17 × 10⁻³ counts s-1 for all EPIC cameras together, in the 0.3 to 12 keV energy band. We extracted the background counts from a circle centered at 0:45:43.41 +4:10:04.25 with a radius of 34 arcsec. We repeated the analysis for three control positions (0:45:48.03 +4:10:42.07, 0:45:49.66 +4:10:40.22, 0:45:50.43 +4:10:16.87) selected as described above and obtained count rates that are in agreement with no source flux −0.63 ± 0.93 × 10⁻⁴ counts s-1, −1.17 ± 0.88 × 10⁻⁴ counts s-1, and −1.40 ± 0.87 × 10⁻⁴ counts s-1.
3.2. X-ray spectra of PG 0043+039
Given the low number of accumulated counts we added the pn, MOS1, and MOS2 spectra for each observation and calculated the corresponding auxiliary files. For the calculations, each input file was weighted with the corresponding exposure time of the camera. All modeling was done with Xspec 12.8.2 (Arnaud 1996). We used C-statistics and a spectrum that was slightly binned, such that each bin contains at the minimum two counts. In addition, for Obs2, we analyzed a spectrum that was binned such that each bin contained 15 counts. For this spectrum, we applied the χ2-statistics and F-test.
The errors of best-fit parameters are provided to the 90% confidence level if not stated otherwise. For the description of absorption, we used the xspec model tbnew, which is based on Wilms et al. (2000), solar abundances from Wilms et al. (2000), and photoelectric cross-sections from Verner et al. (1996).
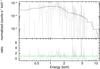 |
Fig. 1 EPIC spectrum of PG 0043+039 from 2013 is shown in comparison to the best-fit power law absorbed by Galactic column density. Data are slightly binned, such that each bin contains at the minimum, two source counts. |
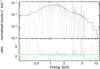 |
Fig. 2 EPIC spectrum of PG 0043+039 from 2013 is shown in comparison to the best-fit power law absorbed by Galactic column density and intrinsic neutral absorption. Data are slightly binned, such that each bin contains, at the minimum, two source counts. |
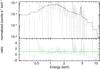 |
Fig. 3 EPIC spectrum of PG 0043+039 from 2013 shown in comparison to the best-fit intrinsic absorbed power law plus neutral iron line. Data are slightly binned, such that each bin contains, at the minimum, two source counts. |
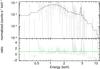 |
Fig. 4 EPIC spectrum of PG 0043+039 from 2013 shown in comparison to model assuming an absorbed primary power-law continuum and reflection on distant, optical thick material. Data are slightly binned, such that each bin contains, at the minimum, two source counts. |
Observation 2:
Figure 1 shows the best-fit power law on the EPIC spectrum of PG 0043+039 from 2013 compared to the data. The fit (C = 61.5, d.o.f. = 58) reveals a very hard spectrum with Γ = 1.09 ± 0.24. We therefore modeled the data with a power law absorbed by neutral material at the redshift of the quasar (Fig. 2), which allowed us to decrease C by ΔC = 6.0. The residuals show enhanced emission at about 4.8 keV, which could correspond to neutral iron Kα in the rest frame of the quasar. We therefore added a neutral iron line to the model (E = 6.4 keV, σ = 10 eV), which allowed us to further decrease C by ΔC = 5.8 (Fig. 3). For the fit, we obtained C = 49.7 for d.o.f. = 56 with the following parameters:  cm-2,
cm-2,  , N(power law)
  keV-1 cm-2 s-1 at 1 keV and N(Gauss)
  photons cm-2 s-1. For the total model, we obtained the following fluxes: F(2.0−10.0 keV)
  erg cm2 s-1, F(0.2−2.0 keV)
  erg cm2 s-1, and F(0.2−12.0 keV)
  erg cm2 s-1, where the flux errors are provided for the 68% confidence.
In addition we modeled the EPIC spectrum of Obs2, binned such that each bin containing 15 counts, using χ2-statistics. We obtained χ2 = 12.9 at d.o.f. = 8 for a simple power-law fit and χ2 = 4.6 at d.o.f. = 6 for an intrinsically absorbed power law plus an iron line. An F-test shows that the probability of finding the improvement by random chance is below 5%.
The performed fits applying the C-statistics show that allowing intrinsic absorption and then adding an iron line both improve the description of the data. The achieved decrease of C does not allow us to claim a significant detection. The F-test confirms that modeling the data with intrinsic absorption and an iron line improves the description, but does not allow us to claim a significant detection.
X-ray weakness of quasars might be explained with a completely absorbed X-ray continuum in combination with a weak so-called escaping reflection component. Therefore, we modeled the EPIC spectrum of Obs2, assuming an absorbed primary power-law continuum and an unabsorbed reflection component. We described the reflection with the model pexmon, which is provided in Xspec (Nandra et al. 2007). This model assumes neutral Compton reflection at distant, optically thick material and considers line emission consistently (Nandra et al. 2007).
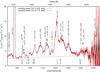 |
Fig. 5 HST-COS FUV spectrum of PG 0043+039 corrected for Galactic reddening. The brown line (see Paper I) shows an approximation of the continuum. Below the spectrum the locations of possible absorption lines are indicated. |
Figure 4 shows the best-fit model assuming an intrinsic absorbed power law plus an unabsorbed reflection compared to the data. For the fit, we obtained C = 49.6 for d.o.f. = 56. The primary power-law continuum is absorbed with  cm-2. As the power-law index is poorly constrained, we fixed the index to Γ = 1.9, which corresponds to the mean value obtained for radio-quiet quasars of the Palomar-Green (PG) Bright Quasar Survey sample for the 2 keV to 10 keV energy range (Piconcelli et al. 2005) and obtained N(power law)
  keV-1 cm-1 s-1. For the reflection component, we fixed the photon index to Γ = 1.9 (Piconcelli et al. 2005), the cut-off energy to 100 keV, the metals to solar abundance, and the inclination angle to 45 degree. We determined the iron abundance Fe
 and N(pexmon)
  photons cm-2 s-1 at 1 keV; see Nandra et al. (2007) and Arnaud (1996) for further details. Finally, we tested whether an absorbed, reflection-only model could describe the data. The idea is to assume a completely absorbed primary continuum so that only the reflected component can reach an observer in our direction. The obtained C values were significantly larger with Δ C = 26.1 for d.o.f. = 55. In addition, we tried to fit the spectrum, which is binned with 15 counts per bin, with this model by applying the χ2-statistics. We were unable to obtain a statistically valid description of the data and therefore we exclude this scenario.
Observation 1:
given the low number of counts collected during the XMM-Newton observation of PG 0043+039 in 2005 we analyzed the data compared to our findings described in the previous paragraph. This analysis was led by two questions: (1) can we detect the components that we found in Obs2? and (2) are the components absorbed by additional material that was not present in Obs2?
We fitted the EPIC spectra of Obs1 with a model consisting of an absorbed power law plus iron emission line. With exception of the normalizations, all parameters were fixed to the values obtained for Obs2, e.g., NH = 5.5 × 1021 cm-2 and Γ = 1.70. We obtained C = 66.3 for d.o.f. = 40 with N(power law)  keV-1 cm-2 s-1 at 1 keV and N(Gauss)
  photons cm-2 s-1. Given these numbers we are not able to detect the iron line in Obs1. We then took the power-law continuum as determined for Obs2 and determined a formal absorbing column density, which is required to model the data of Obs1. We obtained NH(power law)
  cm-2 (C = 75.5 for d.o.f. = 41). We applied the same procedure for the Gaussian line fit and obtained: NH(Gauss)
  cm-2 (C = 83.7 for d.o.f. = 41).
We followed the same strategy with the physical model assuming an absorbed primary power-law continuum and Compton reflection on distant, optically thick material (Nandra et al. 2007). Again we fixed all model parameters to the best-fit values obtained for Obs2 with the exception of the normalizations, which were free to vary. We obtained C = 66.7 for d.o.f. = 40 with N(power law)  keV-1 cm-2 s-1 at 1 keV and N(reflection)
  photons cm-2 s-1. In agreement with the analysis above, we conclude that we are unable to detect the reflection component in the data of Obs1. Similarly, we determined formal column densities for the physical model. For each component (continuum and reflection) individually we froze the model parameters to the values of the best fit of Obs2 and determined a formal column density required to describe the data of Obs1. We obtained NH(power law)
  cm-2 (C = 76.3 for d.o.f. = 41) and NH(reflection)
  cm-2 (C = 82.4 for d.o.f. = 41).
3.3. HST UV/FUV spectra of PG 0043+039
The UV spectrum of PG 0043+039 we took with HST in 2013 is shown in Fig. 5. The observed wavelength range from ~1140 Å to ~2150 Å corresponds to an intrinsic wavelength range of ~820 Å to ~1550 Å.
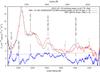 |
Fig. 6 UV spectral variability: HST UV spectra of PG 0043+039 taken in the years 2013 (red) and in 1991, with flux multiplied by a factor 1.8 (black), as well as their difference spectrum (blue). |
Emission line intensities in rest frame and corrected for Galactic extinction.
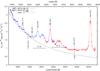 |
Fig. 7 Combined optical spectrum of PG 0043+039 taken with the HET and SALT telescopes in 2013. |
The HST-COS spectrum has been smoothed by means of two different running mean widths (Δλ = 1.8 and 5.7 Å in rest frame) for highlighting weaker spectral structures. We indicate the identifications of the strongest UV emission lines, of the geo-coronal lines Lyα and O viλ1038, as well as of other emission lines, which we attribute to two cyclotron systems A and B with their 3rd, 4th, 5th, 6th, and 7th harmonics. The integer numbers identify the emission humps with multiples of the cyclotron fundamental (see Paper I). This means, for example, that cycA5 is the fifth harmonic of the cyclotron system A. The second number gives the wavelength. We discuss the relative intensities and the equivalent widths of the strongest emission lines O viλ1038, Lyα, and N vλ1243 in PG 0043+039 in comparison to non-BAL quasars in Sect. 4.2. We show a power-law continuum Nν ~ να with α = 0.69 ± 0.02. based on the near and far-UV spectra (see Fig. 13 in the discussion section). The locations of possible absorption lines are indicated below the spectrum. We show the positions of the strongest absorption lines of an average BAL quasar (taken from Baskin et al. 2013, their Fig. 3). The distribution of these possible absorption lines blueward of Lyα cannot produce artificial emission features that are comparable with the observed spectral humps.
During the first inspection of our only FUV spectrum (Fig. 5) it was difficult to derive the UV continuum. However, regions in the long-ultraviolet spectrum at about 1330−1350 , 1700−1720, and 1975−2000 Å are generally free from strong absorption or emission features in AGN (e.g., Gibson et al. 2009). Therefore, we combined our short-wavelength UV spectrum with the long-wavelength UV spectrum taken in 1991 and tried to fit a continuum in the long-wavelength region first. Afterward, we extrapolated this continuum (a simple power law) to our short-wavelength UV spectrum. This power law perfectly fits the continuum in the 900−1000 Å range. At the end, we used the spectral ranges at 895, 983, 1360, 1610, 1690, and 1980 Å with typical widths of 10 Å (see Paper I, Fig. 1) to fit the UV continuum.
The obtained UV/FUV spectrum of PG 0043+039 is very exceptional in comparison to other quasars and/or BAL quasars (Hall et al. 2002; Baskin et al. 2013; Saez et al. 2012) regarding the emission lines. The intensities and the wavelengths of identified optical/UV lines are given in Table 1. The relative line fluxes with respect to Hβ = 1.0 are given in Col. 3. There is no detectable Lyman edge associated with the BAL absorbing gas.
Figure 6 presents the common wavelength range of our HST-COS UV spectrum taken in 2013 together with the HST-FOS spectrum of PG 0043+03 taken in 1991 (Turnshek et al. 1994; multiplied by a factor of 1.8). At the bottom of this figure the difference between the two spectra is shown (i.e., the spectrum taken in 2013 subtracted by the spectrum taken in 1991). Here some additional weak broad emission lines (e.g., C iiiλ1175, N vλ1243, Si vλ1403) sitting on top of broad bumps can be identified by comparing our recent UV spectrum with the HST-FOS spectrum taken in 1991 (see the discussion section). It is remarkable that these lines were not identifiable in the UV spectrum taken in 1991.
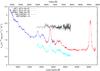 |
Fig. 8 Optical variability: combined optical spectra of PG 0043+039 taken with the HET and SALT telescopes in 2013, an optical spectrum taken with the KPNO in 1990, as well as the difference between the spectra taken in 2013 and 1990 (additionally shifted by 0.6). A horizontal line is added to the difference spectrum to guide the eye. |
3.4. Optical spectra of PG 0043+039
A combined optical spectrum of PG 0043+039 is shown in Fig. 7 composed of the two spectra taken with the HET and SALT telescopes in 2013.
This spectrum has been corrected for Galactic extinction. The blue spectrum taken with the HET telescope and the red spectrum taken with the SALT Telescope perfectly overlap in the common Hβ region. The observed total spectral range from ~4390 Å to ~9400 Å corresponds to a rest-frame spectrum from ~3170 Å to ~6790 Å. PG 0043+039 is a strong optical FeII emitter following Turnshek et al. (1994). In addition, Balmer lines dominate the optical spectrum, and there are no indications of the presence of narrow [O iii] λ5007,λ4959 lines. In contrast to Turnshek et al. (1994), we clearly detect in our recent spectra a broad He i λ5876 line and a weak narrow [O ii] λ3727 line. The underlying continuum of the optical spectrum shows a strong blue gradient. A power-law continuum Nν ~ να with α = −2.55 ± 0.02 is indicated based on continua points at 3325, 3550, 3805, and 4010 Å with typical widths of 10 Å. We present in Table 1 the measured UV and optical emission line intensities for PG 0043+039 in rest frame and corrected for Galactic extinction. We integrated the emission line intensities between the wavelength boundaries given in this table. First we subtracted a linear pseudocontinuum defined by the wavelength ranges (Cols. 5, 6), then we integrated the emission line flux. In some cases, we only extrapolated the continuum from one side.
Figure 8 shows the combined optical spectra of PG 0043+039 taken with the HET and SALT telescopes in 2013 together with an optical spectrum taken before with the KPNO 2.1 m telescope in Sept. 1990 (Boroson & Green 1992). The spectrum taken in 2013 is brighter by a constant factor of 1.8 compared to the spectrum taken in 1990. This variability factor is similar to that of the UV spectra. In addition, the quotient spectrum between these two epochs (additionally shifted by 0.6) is given in Fig. 8. We added a horizontal line to guide the eye. There are no clear spectral differences to be seen for these two epochs. However, an extended blue wing in Hβ that can be recognized in the FeII subtracted spectrum of Boroson & Green (1992) might have varied.
Line widths (FWHM) and shifts (uppermost 10 percent) of the strongest broad emission lines.
3.5. UV/opt. emission line profiles in PG 0043+039
The emission line profiles contain information about the kinematics of their line emitting regions. The strongest single emission lines in the optical spectra of PG 0043+039 are the Balmer lines Hα and Hβ (see Fig. 7). Besides that, the optical spectrum is dominated by FeII blends. The strongest single emission lines in the UV are the Lyα and O vi λ1038 lines (see Fig. 5). There are further line identifications in our FUV HST-COS spectrum, which we attribute to cyclotron lines. Theses lines have different profiles. We showed the optical and UV profiles in velocity space in Paper I. We present in Table 2 the line widths, i.e., the full width at half maximum (FWHM) and the shifts of their emission line centers (centroid of the uppermost 10 percent).
All the broad emission lines exhibit very similar profiles and have nearly identical line widths of 4000 to 4800 km s-1 (FWHM) except Lyα, which shows a slightly broader line width of 6300 km s-1. This difference might be caused by a varying continuum or because of an additional underlying component in the Lyα line. The width (FWHM) of our recent Hβ line measurement is narrower by 500 km s-1with respect to the spectrum taken by Boroson & Green (1992) in 1990. However, our value corresponds with that of Ho & Kim (2009) in 2004. The differences in line width might have been caused by line variations in the meantime.
All the cyclotron lines show very similar line widths of about 10 000 km s-1, on the one hand, and they have entirely different line shapes in comparison to those of the normal emission lines (FWHM ~ 5000 km s-1), on the other hand.
The [O ii]λ3727 line is the only narrow forbidden emission line detected in PG 0043+039. This [O ii]λ3727 line exhibits a line width (FWHM) of 6.6 Å, corresponding to a velocity of 530 km s-1 (see Fig. 10). The Balmer lines exhibit the same systemic redshift as this narrow emission line [O ii] λ3727. The O vi λ1038 shows an internal redshift of 390 ± 150 km s-1. However, this might be feigned because of absorption of the blue O vi doublet component (see Fig. 9). The Lyα line is definitely blueshifted by 860 ± 150 km s-1.
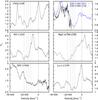 |
Fig. 9 Possible absorption profiles belonging to the OVI, NV, SiIV, CIV, MgII, and Lyα lines. The profiles are divided by the assumed continuum. The velocity scale is calculated relative to the reddest line of each multiplet. The location of possible absorption lines, based on local minima, is indicated with the vertical tick marks at different velocities. |
3.6. UV/Opt. absorption line systems in PG 0043+039
PG 0043+039 has been classified as a BAL quasar (Turnshek et al. 1994) based on a broad CIV absorption at a blueshift of ~10 000 km s-1. We searched in our far-UV spectrum for additional absorption lines belonging to commonly expected absorption line systems of, for example, the O viλ1038, N vλ1243, Si vλ1403, and Lyα lines etc. The C ivλ1550 line profile seen in our spectrum taken in 2013 is very noisy and only covers the blue wing at the outermost edge of our HST spectrum. The C ivλ1550 line profile, taken with the HST in 1991, is overlayed in Fig. 9. We show in Fig. 9 possible absorption profiles belonging to the OVI, NV, SiIV, CIV, MgII, and Lyα lines. The profiles are divided by the assumed continuum. The velocity scale is calculated relative to the reddest line of each multiplet. The stronger blue component at about −1000 km s-1is missing in the O vi doublet (λ1032,1038). This points to an absorption component at v ~ 0 km s-1. The same behavior is indicated in the other high-ionization lines of the C ivλ1550 and N vλ1243 doublets. Additional possible positions of absorption lines belonging to prominent UV lines are indicated with vertical tick marks at −20 000, −16 000, −13 700, −11 000, −9000 km s-1. Here we labeled local minima in the spectrum shortward of the emission lines. However, no absorption troughs could be unambiguously connected to any of the emission lines except for the CIV absorption. A further aspect of our present study is the detection of additional blueshifted BALs in the optical spectrum of PG 0043+039. In Fig. 10 we present an extract of our optical spectrum in the range of the narrow [O ii]λ3727 emission line as well as CaII H and K absorption lines. Figure 11 shows an enlarged section of our optical spectrum of PG 0043+039 around the NaD absorption region. We are able to identify weak absorption lines of Na D λ5890/96, and the CaH λ3968 and CaK λ3934 lines at the systemic velocity of the galaxy. Their absorption line equivalent widths are listed in Table 3.
In addition to the absorption system at the systemic velocity, we can verify an absorption system (BAL I) consisting of the CaH λ3968, CaH λ3934, and He i λ3889 lines (see Fig. 10). Figure 12 shows the lines of the BAL I system in velocity space. The CaH λ3968 and CaH λ3934 lines are blueshifted by 4900 km s-1 and the He i λ3889 line is blueshifted by ~5600 km s-1. A similar absorption line system at a related blueshift has been found before in the peculiar BAL galaxy Mrk 231 (Boksenberg et al. 1977). In this galaxy even three BAL systems have been identified at different velocities and they vary independently (e.g., Kollatschny et al. 1992; Lipari et al. 2009). However, in contrast to Mrk 231 we see no indication for a Na D absorption at a blueshift of ~5100 km s-1 within the error limits.
3.7. Overall spectral slope in PG 0043+039
We present a combination of our optical and UV spectra of PG 0043+039 taken in the summer of 2013 in Fig. 13. In addition a transition spectrum is overplotted taken with the coaligned 30-cm optical/UV telescope (OM) on board the XMM-Newton satellite in 2005. We multiplied the observed OM spectrum with a factor of 1.7 to align it with the optical and UV spectra taken in 2013. In addition, we present the power-law continua adapted to the UV as well as optical spectral ranges. There is a clear maximum in the overall continuum flux at around 2500 Å (rest frame). The flux is getting weaker toward shorter and longer wavelengths. We compute a very steep UV power-law slope parameter αox = −2.55 ± 0.3 based on the near- and far-UV data.
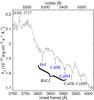 |
Fig. 10 Enlargement of the optical rest-frame spectrum around the narrow [O ii]λ3727 emission and CaII H and K absorption lines. The BAL I system (blue) consists of the CaH λ3968, CaK λ3934 lines (blueshifted by ~4900 km s-1) and the He i λ3889 line (blueshifted by ~5600 km s-1). |
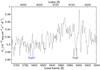 |
Fig. 11 Enlargement of the optical rest-frame spectrum around the intrinsic NaD absorption lines as well as around a possible blueshifted NaD absorption. |
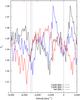 |
Fig. 12 Absorption lines of the BAL I system (CaH λ3968, CaK λ3934, and He i λ3889 lines) in velocity space. |
A maximum in the transition region between the optical and UV spectral range has been noted before by Turnshek et al. (1994). They assigned this slope to intrinsic reddening of E(B−V) = 0.11 mag from dust similar to that found in the Small Magellanic Cloud (SMC).
The multiwavelength spectral energy distribution of PG 0043+039 from the 6 cm radio (VLA) to the hard X-ray (NuStar) frequencies is shown in Fig. 14. The radio observations with the VLA taken in 1982 were published by Kellermann et al. (1989). In addition to its faintness in X-ray wavelengths, PG 0043+039 is a weak radio source. This behavior is consistent with the general radio/X-ray luminosity relation for radio-quiet quasars (Laor & Behar 2008). Serjeant & Hatziminaoglou (2009) presented the infrared IRAS observations at 60 and 100 μ taken in 1983. The Spitzer infrared and GALEX UV data were taken from their archives.
4. Discussion
4.1. Continuum and line intensity variations
We observed variations in the optical, UV, and X-ray continuum flux of PG 0043+039. Our observations show an increase in the optical and UV continuum fluxes by a factor of 1.8 for 2013 compared to observations taken in 1990/1991. Turnshek et al. (1994) reported optical and UV decreasing flux variations of PG 0043+039 at earlier epochs with respect to their spectra taken in 1991. This means that PG 0043+039 was in a low state in 1991. PG 0043+039 was by a factor of ~1.6 brighter in the optical in 1981 in comparison to their observations in 1990. The same is true for the UV continuum flux in 1986.
Optical/UV absorption line equivalent widths and their shifts.
PG 0043+039 has varied in the X-ray continuum as well. While this object was not verified in the X-ray in 2005 in the first analysis (Czerny et al. 2008), it now has been proven in 2013. The flux increased by a factor of 3.8 ± 0.9. The X-ray variations of PG 0043+039 were on the same order or even stronger in comparison with long-term X-ray variations of other BAL quasars (see Saez et al. 2012). For example, Mrk 231 varied in the X-ray by a factor 1.3 ± 0.2 over a period of 20 years.
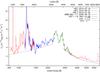 |
Fig. 13 Combined optical-UV spectra of PG 0043+039, corrected for Galactic reddening, taken in the years 2013 (red lines) and 1990/1991 (blue lines). In addition the spectral OM data are given taken with the XMM-Newton satellite in 2005 (green data). Furthermore, the power-law continua to the UV and optical spectral ranges are shown. |
Details of the spectroscopic variations in PG 0043+039 seem to be even more complex in comparison to their general continuum variations. In the UV difference spectrum, based on HST spectra taken in 1991 and 2013 (see Fig. 6), individual emission lines stick out after correction for a general intensity that increases by a factor of 1.8. These lines have not been seen in the 1991 UV spectrum. In addition, there are evident variations in some broader UV structures (in intensity and wavelength). This variability behavior is different with respect to what is known from normal spectral variations of AGN (e.g., Kollatschny et al. 2014). A detailed analysis of these variations in PG 0043+039 is beyond the scope of this paper.
4.2. Emission lines in PG 0043+039
The Balmer lines Hα, Hβ, and Hγ (see Fig. 7) are the strongest emission lines in the optical spectrum of PG 0043+039 besides strong FeII blends. Again the optical spectrum of PG 0043+039 shows similarities to that of Mrk 231, however, the relative strength of the optical FeII blends is even stronger in Mrk 231 (Boksenberg et al. 1977; Lipari et al. 2009) when compared to PG 0043+039. The line intensity ratio of the broad Hα to Hβ lines has a value 2.38 (Table 1) and cannot be understood with simple photoionization models in which values of 2.8 or more are expected.
The [O ii]λ3727 line is the only verified narrow forbidden emission line in PG 0043+039. We can verify this line in our optical spectrum in contrast to Turnshek et al. (1994) who reported their absence. The [O ii]λ3727 line is the only detected forbidden line in Mrk 231 as well (Boksenberg et al. 1977; Lipari et al. 2009). Based on the fact that there are only upper limits for the [O iii]λ5007 line intensities in both galaxies, we find that the intensity ratio [O ii]λ3727/[O iii]λ5007 is higher in PG 0043+039 and Mrk 231 in comparison to normal AGN. It is known that there is an anticorrelation between the strengths of the [O iii]λ5007 line and the FeII blends (Eigenvector 1; e.g., Sulentic et al. 2000). However, an analogical anticorrelation of the [O ii]λ3727/[O iii]λ5007 ratio has not been studied yet.
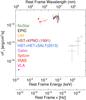 |
Fig. 14 Combined overall spectrum (radio to hard X-ray) for PG 0043+039. |
Typically, the Lyα, O vi λ1038, and N v λ1243 lines are the strongest emission lines in the UV range from 800 to 1500 Å in AGN. We derived line intensity ratios for these emission lines in PG 0043+039 (see Table 1 and Fig. 16), which are very similar to those seen in mean composite AGN spectra (Shull et al. 2012). However, PG 0043+039 shows additional strong broad lines in its FUV spectrum, which could not be attributed to known emission lines.
We present in Fig. 15 the combined UV-spectrum of PG 0043+039 and a composite HST/COS spectrum of 22 non-BAL quasars taken from Shull et al. (2012). The UV continua of both spectra show different gradients and emission line spectra. We compare in Fig. 16 the relative UV emission line intensities in PG 0043+039 with respect to the composite HST/COS AGN spectrum. We subtracted the continua first and scaled both spectra to match the O viλ1038 and N vλ1243 line intensities by means of a single scaling factor. Both spectra are similar with respect to the relative intensities of the strongest emission lines, O viλ1038, Lyα and N vλ1243, as well as their equivalent widths (see Table 4). However, they differ with respect to the C iv λ1550 line absorption and with respect to the strong broad humps. In Paper I we presented a modeling of these observed strong humps in PG 0043+039 by means of cyclotron lines. They are not seen in the composite AGN spectrum. We derived plasma temperatures of T ~ 3 keV and magnetic field strengths of B ~ 2 × 10⁸ G for the cyclotron line-emitting regions close to the black hole. With this modeling, we could explain the wavelength positions of the broad humps and their relative intensities. Figure 17 shows the UV spectrum of PG 0043+039 in frequency space with the identifications of the cyclotron systems A and B with their second to seventh harmonics in addition to the normal emission lines (see Paper I for more details).
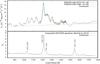 |
Fig. 15 Comparison of the UV emission line intensities in PG 0043+039 (upper panel) with respect to a composite HST/COS spectrum of 22 AGN (Shull et al. 2012, lower panel). We combined the two ultraviolet spectra of PG 0043+039 taken with the HST in the years 2013 and 1991. The UV line and continuum intensities increased by a factor of 1.8 between these two observations. We multiplied the UV spectral flux taken in 1991 with this factor to match the UV observations taken in 2013. The continua of both spectra are indicated as brown lines. |
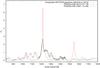 |
Fig. 16 Comparison of the relative UV emission line intensities in PG 0043+039 with respect to a composite HST/COS spectrum of 22 AGN (Shull et al. 2012). The continua have been subtracted first and both spectra are scaled to the same O viλ1038 and N vλ1243 line intensities. |
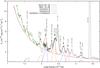 |
Fig. 17 Combined ultraviolet spectra of PG 0043+039 taken with the HST 2013 and 1991. We indicate the identifications of the strongest UV emission lines, the geo-coronal lines, and both cyclotron systems B and A with their 3rd to 7th harmonics. The integer numbers identify the emission humps with multiple of the cyclotron fundamental. We indicate the power-law continuum Nν ~ να with α = 0.69 ± 0.02. The modeling of both cyclotron line systems B and A is given at the bottom. |
Independent indications for magnetic fields of at least tens of Gauss (and possibly considerably higher) on scales on the order of light days from a central black hole have been recently reported by Marti-Vidal (2015). They detected Faraday rotation at sub-mm wavelengths in the nearby AGN 3C84.
PG 0043+039 is a very luminous AGN (MB = −26.11) compared to Mrk 231 (MB = −21.3). However, the blueshift of the Lyα line is stronger in Mrk 231 (−3500 km s-1; Veilleux et al. 2013) than in PG 0043+039 (−860 km s-1). Typical AGN show blueshifts of −400 km s-1. Some additional information is contained in the line profiles as well. Normally, the broad AGN emission lines show different line widths (Mrk110; e.g., Kollatschny 2003a; 2003b) caused by their formation at different distances from the central ionizing source. Besides that, as an example the AGN Mrk 231 shows a peculiar Lyα profile compared to the Balmer lines (Veilleux et al. 2013). In contrast to that, all the broad emission lines in PG 0043+039 show similar line profiles and similar line widths (see Fig. 2 in Paper I) independent of their ionization state. This is an indication that the broad emission line region in PG 0043+039 is not strictly structured and that all these lines originate at similar distances from the central ionizing source.
4.3. Absorption line systems in PG 0043+039
Bahcall et al. (1993) and Turnshek et al. (1994; 1997) classified PG 0043+039 as a BAL quasar based on a broad CIV absorption line at a blueshift of ~10 000 km s-1detected with the HST in 1991. This study did not find convincing evidence for BALs due to low-ionization transitions of AlII or CII, other than for MgII. On the other hand, only about 10 percent of the BAL quasars show these lines (e.g., Trump et al. 2006; Allen et al. 2011). Bechtold et al. (2002) reanalyzed the absorption line spectra of all quasars taken with the high-resolution gratings of the FOS on board of the HST. They could not confirm the existence of broad absorption lines in PG 0043+039 as reported before by Turnshek et al. (1994). They only verified narrow absorption in the Lyα and C iv λ1550 lines at the same redshift as the emission lines. Based on the UV absorption lines profiles in Fig. 9, as well as on the UV spectral distribution in Fig. 13, we confirm a central absorption component at v ~ −800 km s-1 in the high-ionization doublet lines O vi, C iv, N v, and, in addition, a strong, broad absorption component at −11 000 km s-1 in the C iv λ1550 line (see Table 3). The possible identification of a strong, broad absorption component belonging to the MgII λ2798 line at −19 000 km s-1 cannot be unambiguously demonstrated. There is a strong absorption structure in the UV/optical spectral distribution at 2620 Å rest frame (see Fig. 13). However, this structure might not be a real absorption line and it might only be simulated by broad emission line humps at shorter and longer wavelengths.
The single clear identification of the broad C iv λ1550 absorption at −11 000 km s-1in PG 0043+039 is atypical compared to the UV absorption properties in other BAL quasars (see, e.g., Baskin et al. 2013; Hamann et al. 2013). In general, BAL quasars also show absorption features from other high- and low-ionization lines, such as OVI and Lyα. On the other hand, the UV spectrum of PG 0043+039 shows similarities with the UV spectrum of Mrk 213. Veilleux et al. (2013) demonstrated the surprising absence of UV absorption in the FUV spectrum in Mrk 231. Lyα and C iv λ1550 absorption has only been unambiguously identified in Mrk 231. In PG 0043+039, not even an indication of Lyα absorption has been seen.
In the optical spectral range, we verified a BAL I system at a blueshift of ~4900 km s-1 in the CaH λ3968 and CaK λ3934 lines and at a blueshift of ~5600 km s-1 in the He i λ3889 line. A similar system with similar shifts has been identified before in the peculiar BAL galaxy Mrk 231 (Boksenberg et al. 1977). The velocity of the high-ionization line He i is slightly higher than that of the low-ionization Ca ii lines. It has been proposed by Voit et al. (1993) that the low-ionization lines could be produced in dense cores with relatively lower velocity, while the high-ionization lines are produced in a thinner wind, possibly ablated from the cores and accelerated (see also the discussion in Leighly et al. 2014). In Mrk 231 even three BAL systems at different velocities have been found and these systems varied independently (e.g., Kollatschny et al. 1992; Lipari et al. 2009).
In PG 0043+039 there is no indication for a Na D BAL absorption at a blueshift of ~5100 km s-1 within the error limits. This nondetection of Na D BAL absorption is an important clue since Na D BAL absorption requires dust (e.g., Veilleux et al. 2013). This strengthens the model that dust absorption is not responsible for the weak FUV flux in PG 0043+039.
4.4. Opt/UV/X-ray slope
Based on our simultaneous observations in different frequency ranges, we could show that the X-ray faintness of PG 0043+039 is intrinsic and not simulated by variations. The αox gradient is shown in Fig. 18 for a sample of AGN as a function of the monochromatic luminosity at rest-frame 2500 Å (upper panel) and the monochromatic luminosity at 2 keV versus the monochromatic luminosity at 2500 Å (lower panel). Black-filled circles indicate the SDSS objects with 0.1 ≤ z ≤ 4.5 from Strateva et al. (2005), while gray-filled circles label the data from Steffen et al. (2006). The long-dashed lines are the best-fit linear relations for the samples by Strateva et al. (2005). The dotted line represents the best fit to the sample of Steffen et al. (2006). Further measurements of extreme X-ray weak quasars (Saez et al. 2012) are incorporated by cyan circles. Additional observations are given for the quasars PG 2112+059 (blue open triangle; Schartel et al. 2010, 2007), PG 1535+547 (green star; Ballo et al. 2008), and PG 1700+518 (yellow open circle; Ballo et al. 2011). Among all galaxies PG 0043+039 shows the most extreme αox gradient (αox = −2.55) based on the data taken in 2005. The X-ray flux of this AGN increased by a factor of 3.8 in 2013. However, it still shows a very extreme αox gradient (αox = −2.37) at that epoch. We presented the extreme UV/X-ray weakness of PG 0043+039 compared to a mean spectral distribution of QSOs (Richards et al. 2006) in Fig. 3 of Paper I.
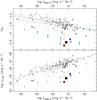 |
Fig. 18 The αox gradient as a function of the monochromatic luminosity at rest-frame 2500 Å (upper panel) and the monochromatic luminosity at 2 keV versus the monochromatic luminosity at 2500 Å (lower panel). Black-filled circles indicate the SDSS objects with 0.1 ≤ z ≤ 4.5 from Strateva et al. (2005), while gray-filled circles label the data from Steffen et al. (2006). The dotted line represents the best fit to the sample of Steffen et al. (2006). Further measurements of extreme X-ray weak quasars are indicated with cyan circles (Saez et al. 2012). The positions of PG 0043+039 are highlighted for the years 2005 (red square) and 2013 (black circle). |
There is the question as to what causes the extreme X-ray faintness of PG 0043+039. We observed PG 0043+039 simultaneously in the optical, UV, and X-ray bands to exclude that an apparent X-ray weakness is simulated by variations. Another possible explanation of the extreme X-ray faintness could be the absorption of the X-ray flux due to gas. However, the X-ray faintness of PG 0043+039 is consistent with the extrapolation of its faint UV-flux (Fig. 3 of Paper I). Furthermore, the upper limit seen in the hard X-ray flux, and confirmed by the simultaneous NuSTAR observations (Luo et al. 2014), is a further indication of an intrinsically X-ray faintness (Fig. 14). Other arguments against X-ray absorption come from the results of X-ray modeling; the X-ray spectra show no sign of extreme absorption. Intrinsically absorbed power-law fits give a power-law index of 1.7. This is compatible with the standard value 1.9 and NH = 5.5 × 1021 cm-2, which is not enough to explain the extreme weakness of the quasar. Moreover, the explanation that the X-ray spectrum has a completely absorbed primary continuum and an absorbed reflection failed (Sect. 3.2).
A possible explanation for the weakness of the X-ray flux might be the suppression of a hot inner accretion disk in PG 0043+039. It is generally accepted that the main contribution to the X-ray flux of AGN is coming from a hot corona surrounding the inner accretion disk via comptonization of UV photons from the disk (Haardt & Maraschi 1991; Luo et al. 2014). If there is no inner accretion disk, then a strong X-ray emitting corona could not evolve. The link between the disk and the corona has also been independently demonstrated by Gliozzi et al. (2013), based on an AGN long-term monitoring campaign with Swift.
There are further indications for the nonexistence of a hot inner accretion disk in PG 0043+039 (besides the X-ray weakness): the UV/FUV flux is suppressed in this galaxy. There is a maximum in the UV continuum flux at around λ ≈ 2500 Å. The flux decreases toward shorter wavelengths in contrast to most other AGN in which a maximum is found at around λ ≈ 1000 Å (e.g., Vanden Berk et al. 2001). A turnover at this wavelength corresponds to a maximal accretion disk temperature of Tmax ≈ 50 000 K (Laor & Davis 2014, and references therein). Therefore, a turnover at 2500 Å as seen in PG 0043+039 should only correspond to a temperature of about 20 000 K. It is generally accepted that the observed FUV continuum emission in AGN is produced by an accretion disk.
The weak UV flux in PG 0043+039 has been interpreted by Turnshek et al. (1994) as intrinsic reddening of SMC-like dust. However, their spectral fit did not correspond with the observations with this kind of a reddening correction. Furthermore, that assumption leads to a surprising low BAL region column density. In the end, they admitted that intrinsic dust extinction might not be the only plausible explanation for the turndown in the continuum flux shortward of 2200 Å. Similarly, Veilleux et al. (2013) tried to model the turndown in the UV continuum flux in Mrk 231. However, another plausible explanation for the weak FUV continuum flux might be the hypothesis that there is simply no FUV flux emitted because of a nonexisting hot inner accretion disk. In the same spirit, some quasars have been identified that show unusual weak blue continua (e.g., Hall et al. 2002; Meusinger et al. 2012). We see no Lyman edge (λ< 912 Å) in our spectrum of PG 0043+039, in accordance to the ultraviolet composite spectrum of some AGN (Shull et al. 2012). Baskin et al. (2013) also saw no detectable Lyman edge associated with the BAL absorbing gas.
It is known from cataclysmic stars as AMHer stars, so-called polars, as well as from intermediate polars that they host strong magnetic fields. Their magnetic fields, on the order of 108 G, are responsible for the prevention of the formation of an (inner) accretion disk in these objects. Analogically, the expansion of magnetic bridges between the ergosphere and the disk around rapidly rotating black holes could be responsible for an outward shift of the inner accretion disk (Koide et al. 2006).
Another indication of an accretion disk that is not that extended comes from the widths of the Balmer, Lyα, and O vi λ1038 lines (see Paper I). Typically, the broad emission lines have different widths, as they originate at different distances from the central ionizing source (e.g., in Mrk 110, Kollatschny 2003a; 2003b). However, all the low- and high-ionization lines in PG 0043+039 show the same widths, indicating that they originate at the same distances from the central ionizing region.
5. Summary
We took deep X-ray spectra with the XMM-Newton satellite, FUV spectra with the HST, and optical spectra of PG 0043+039 with the HET and SALT telescopes in July, 2013. PG 0043+039 is one of the weakest quasars in the X-ray. We barely detected this object in our new deep X-ray exposure. It has an extreme αox continuum gradient of αox = −2.37. However, the X-ray spectra show no sign of extreme absorption. Moreover, an attempt to explain the X-ray spectrum with a completely absorbed primary continuum and an absorbed reflection has failed.
PG 0043+039 shows a maximum in the overall continuum flux at around λ ≈ 2500 Å in contrast to most other AGN where a maximum is found at shorter wavelengths. In combination with its intrinsic X-ray weakness this is an indication for an accretion disk that is not that hot compared to most other AGN.
PG 0043+039 has been classified as a BAL quasar before, based on a broad CIV absorption. We detected no further absorption lines in our FUV spectra. However, in the optical we found a narrow BAL system in the CaH λ3968, CaK λ3934 lines (blueshifted by 4900 km s-1), and in the He i λ3889 line (blueshifted by 5600 km s-1).
The UV/optical flux of PG 0043+039 has increased by a factor of 1.8 compared to spectra taken in 1990/1991. Some UV emission lines appeared in the new UV spectrum taken in 2013, which were not present in the spectrum from 1991. In addition, the UV spectrum is highly peculiar showing no Lyman edge. Furthermore, strong broad humps are to be seen in the FUV, which have not been identified before in other AGN. We modeled the observed strong humps in the UV spectrum of PG 0043+039 by means of cyclotron lines. We derived plasma temperatures of T ~ 3 keV and magnetic field strengths of B ~ 2 × 10⁸ G for the cyclotron line-emitting regions close to the black hole (see Paper I).
Acknowledgments
This work has been supported by the DFG grant Ko 857/32-2. Some of the observations reported in this paper were obtained with the Southern African Large Telescope (SALT). The Hobby-Eberly Telescope (HET) is a joint project of the University of Texas at Austin, the Pennsylvania State University, Stanford University, Ludwig-Maximilians-Universität München, and Georg-August-Universität Göttingen. This research has made use of the NASA/IPAC Infrared Science Archive, which is operated by the Jet Propulsion Laboratory, California Institute of Technology, under contract with the National Aeronautics and Space Administration. Some GALEX data presented in this paper were obtained from the Mikulski Archive for Space Telescopes (MAST). STScI is operated by the Association of Universities for Research in Astronomy, Inc., under NASA contract NAS5-26555. Support for MAST for non-HST data is provided by the NASA Office of Space Science via grant NNX09AF08G and by other grants and contracts.
References
- Allen, J. T., Hewett, P. C., Maddox, N., et al. 2011, MNRAS, 410, 860 [NASA ADS] [CrossRef] [Google Scholar]
- Arnaud, K. A. 1996, ASP Conf. Ser., 101, 17 [Google Scholar]
- Bahcall, J. N., Bergeron, J., Boksenberg, A., et al. 1993, ApJS, 87, 1 [NASA ADS] [CrossRef] [Google Scholar]
- Ballo, L., Giustini, M., Schartel, N., et al. 2008, A&A, 483, 137 [NASA ADS] [CrossRef] [EDP Sciences] [Google Scholar]
- Ballo, L., Piconcelli, E., Vignali, C., et al. 2011, MNRAS, 415, 2600 [NASA ADS] [CrossRef] [Google Scholar]
- Baskin, A., & Laor, A. 2004, MNRAS, 350, L1 [Google Scholar]
- Baskin, A., & Laor, A. 2005, MNRAS, 356, 1029 [NASA ADS] [CrossRef] [Google Scholar]
- Baskin, A., Laor, A., & Hamann, F. 2013, MNRAS, 432, 1525 [NASA ADS] [CrossRef] [Google Scholar]
- Bechtold, J., Dobrzycki, A., Wilden, B., et al. 2002, ApJS, 140, 143 [NASA ADS] [CrossRef] [Google Scholar]
- Bianchi, S., Pinconcelli, E., Chiaberge, M., et al. 2009, ApJ, 695, 781 [NASA ADS] [CrossRef] [Google Scholar]
- Boksenberg, A., Carswell, R. F., Allen, D. A., et al. 1977, MNRAS, 178, 451 [NASA ADS] [Google Scholar]
- Boroson, T. A., & Green, R. F. 1992, ApJS, 80, 109 [NASA ADS] [CrossRef] [Google Scholar]
- Brandt, W. N., Espey, B. R., Kopko, JR., M., et al. 2000, ApJ, 528, 637 [NASA ADS] [CrossRef] [Google Scholar]
- Burgh, E. B., Nordsieck, K. H., Kobulnicky, H. A., et al. 2003, Proc. SPIE, 4841, 1463 [Google Scholar]
- Czerny, B., Siemiginowska, A., Janiuk, A., et al. 2008, MNRAS, 386, 1557 [NASA ADS] [CrossRef] [Google Scholar]
- Fabian, A. C., Zoghbi, A., Wilkins, D., et al. 2011, MNRAS, 419, 116 [Google Scholar]
- Fitzpatrick, E. L. 1999, PASP, 111, 63 [NASA ADS] [CrossRef] [Google Scholar]
- Gallagher, S. C., Brandt, W. N., Sambruna, R. M., et al. 1999, ApJ, 519, 549 [NASA ADS] [CrossRef] [Google Scholar]
- Gliozzi, M., Papadakis, I. E., Grupe, D., et al. 2013, MNRAS, 433, 1709 [NASA ADS] [CrossRef] [Google Scholar]
- Gibson, R. R., Jiang, L., Brandt, W. N., et al. 2009, ApJ, 692, 758 [NASA ADS] [CrossRef] [Google Scholar]
- Ho, L. C., & Kim, M. 2009, ApJS, 184, 398 [NASA ADS] [CrossRef] [Google Scholar]
- Haardt, F., & Maraschi, L. 1991, ApJ, 380, L51 [NASA ADS] [CrossRef] [Google Scholar]
- Hall, P. B., Anderson, S. F., Strauss, M. A., et al. 2002, ApJS, 141, 267 [NASA ADS] [CrossRef] [Google Scholar]
- Hamann, F., Chartas, G., McGraw, S., et al. 2013, MNRAS, 435, 133 [NASA ADS] [CrossRef] [Google Scholar]
- Jansen, F., Lumb, D., Altieri, B., et al. 2001, A&A, 365, L1 [NASA ADS] [CrossRef] [EDP Sciences] [Google Scholar]
- Kellermann, K. I., Sramek, R., Schnidt, M., Shaffer, D. B., & Green, R. 1989, AJ, 98, 1195 [NASA ADS] [CrossRef] [Google Scholar]
- Koide, S., Kudoh, T., & Shibata, K. 2006, Phys. Rev. D, 74, 044005 [NASA ADS] [CrossRef] [Google Scholar]
- Kollatschny, W. 2003a, A&A, 407, 467 [Google Scholar]
- Kollatschny, W. 2003b, A&A, 412, L61 [NASA ADS] [CrossRef] [EDP Sciences] [Google Scholar]
- Kollatschny, W., & Fricke, K. 1985, A&A, 146, L11 [NASA ADS] [Google Scholar]
- Kollatschny, W., Dietrich, M., & Hagen, H. 1992, A&A, 264, L5 [NASA ADS] [Google Scholar]
- Kollatschny, W., Bischoff, K., Robinson, E. L., et al. 2001, A&A, 379, 125 [NASA ADS] [CrossRef] [EDP Sciences] [Google Scholar]
- Kollatschny, W., Ulbrich, K., Zetzl, M., et al. 2014, A&A, 566, A106 [NASA ADS] [CrossRef] [EDP Sciences] [Google Scholar]
- Kollatschny, W., Schartel, N., Zetzl, M., et al. 2015, A&A, 577, L1 (Paper I) [NASA ADS] [CrossRef] [EDP Sciences] [Google Scholar]
- Laor, A., & Behar, E. 2008, MNRAS, 390, 847 [NASA ADS] [CrossRef] [Google Scholar]
- Laor, A., & Davis, S. W. 2014, MNRAS, 438, 3024 [NASA ADS] [CrossRef] [Google Scholar]
- Leighly, K. M., Hamann, F., Casebeer, D. A., et al. 2009, ApJ, 701, L176 [NASA ADS] [CrossRef] [Google Scholar]
- Leighly, K. M., Terndrup, D. M., Baron, E., et al. 2014, ApJ, 788, 123 [NASA ADS] [CrossRef] [Google Scholar]
- Luo, B., Brandt, W. N., Alexander, D. M., et al. 2014, ApJ, 794, 70 [NASA ADS] [CrossRef] [Google Scholar]
- Lipari, S., Sanchez, S. F., Bergmann, M., et al. 2009, MNRAS, 392, 1295 [NASA ADS] [CrossRef] [Google Scholar]
- Marti-Vidal, I., Muller, S., Vlemmings, W., et al. 2015, Science, 348, 6232 [Google Scholar]
- Mason, K. O., Breeveld, A., Much, R., Carter, M., et al. 2001, A&A, 365, L36 [NASA ADS] [CrossRef] [EDP Sciences] [Google Scholar]
- Meusinger, H., Schalldach, B., Scholz, R.-D., et al. 2012, A&A, 541, A77 [NASA ADS] [CrossRef] [EDP Sciences] [Google Scholar]
- Murray, N., Chiang, J., Grossman, S. A., et al. 1995, ApJ, 451, 498 [NASA ADS] [CrossRef] [Google Scholar]
- Nandra, K., O’Neill, P. M., George, I. M., & Reeves, J. N. 2007, MNRAS, 382, 194 [NASA ADS] [CrossRef] [Google Scholar]
- Page, M. J., Brindle, C., Talavera, A., et al. 2012, MNRAS, 426, 903 [Google Scholar]
- Piconcelli, A., Piconcelli, E., Jiménez-Bailón, E., et al. 2005, A&A, 432, 15 [NASA ADS] [CrossRef] [EDP Sciences] [Google Scholar]
- Richards, G. T., Lacy, M., Storrie-Lombardi, L. J., et al. 2006, ApJS, 166, 470 [NASA ADS] [CrossRef] [Google Scholar]
- Risaliti, G., Elvis, M., Fabbiano, G., et al. 2005, ApJ, 623, L93 [NASA ADS] [CrossRef] [Google Scholar]
- Saez, C., Brandt, W. N., Gallagher, S. C., et al. 2012, ApJ, 759, 42 [NASA ADS] [CrossRef] [Google Scholar]
- Savage, B. D., Lu, L., Bahcall, J. N., et al. 1993, ApJ, 413, 116 [NASA ADS] [CrossRef] [Google Scholar]
- Schartel, N., Rodríguez-Pascual, P. M., Santos-Lleó, M., et al. 2007, A&A, 474, 431 [NASA ADS] [CrossRef] [EDP Sciences] [Google Scholar]
- Schartel, N., Rodríguez-Pascual, P. M., Santos-Lleó, M., et al. 2010, A&A, 512, A75 [NASA ADS] [CrossRef] [EDP Sciences] [Google Scholar]
- Schlafly, E. F., & Finkbeiner, D. P. 2011, ApJ, 737, 103 [NASA ADS] [CrossRef] [Google Scholar]
- Schlegel, D. J., Finkbeiner, D. P., & Davis, M. 1998, ApJ, 500, 525 [NASA ADS] [CrossRef] [Google Scholar]
- Schmidt, M., & Green, R. F. 1983, ApJ, 269, 352 [NASA ADS] [CrossRef] [Google Scholar]
- Serjeant, S., & Hatziminaoglou, E. 2009, MNRAS, 397, 265 [NASA ADS] [CrossRef] [Google Scholar]
- Shappee, B. J., Prieto, J. L., Grupe, D., et al. 2014, ApJ, 788, 48 [NASA ADS] [CrossRef] [Google Scholar]
- Shull, J. M., Stevans, M., & Danforth, C. W. 2012, ApJ, 752, 162 [NASA ADS] [CrossRef] [Google Scholar]
- Steffen, A. T., Strateva, I., Brandt, W. N., et al. 2006, AJ, 131, 2816 [Google Scholar]
- Strateva, I., Brandt, W. N., Schneider, D. P., et al. 2005, AJ, 130, 387 [NASA ADS] [CrossRef] [Google Scholar]
- Strüder, L., Briel, U., Dennerl, K., et al. 2001, A&A, 365, L18 [NASA ADS] [CrossRef] [EDP Sciences] [Google Scholar]
- Sulentic, J. W., Marziani, P., & Dultzin-Hacyan, D. 2000, ARA&A, 38, 521 [NASA ADS] [CrossRef] [Google Scholar]
- Trump, J. R., Hall, P. B., Reichard, T. A., et al. 2006, ApJS, 165, 1 [NASA ADS] [CrossRef] [Google Scholar]
- Turner, M. J. L., Abbey, A., Arnaud, M., et al. 2001, A&A, 365, L27 [NASA ADS] [CrossRef] [EDP Sciences] [Google Scholar]
- Turnshek, D. A., Espey, B. R., Kopko, J. R. M., et al. 1994, ApJ, 428, 93 [NASA ADS] [CrossRef] [Google Scholar]
- Turnshek, D. A., Monier, E. M., Sirola, C. J., et al. 1997, ApJ, 476, 40 [NASA ADS] [CrossRef] [Google Scholar]
- Van den Berk, D. E., Richards, G. T., Bauer, A., et al. 2001, ApJ, 122, 549 [Google Scholar]
- Veilleux, S., Trippe, M., Hamann, F., et al. 2013, ApJ, 764, 15 [NASA ADS] [CrossRef] [Google Scholar]
- Verner, D. A., Ferland, G. J., Korista, K. T., & Yakovlev, D. G. 1996, ApJ, 465, 487 [NASA ADS] [CrossRef] [Google Scholar]
- Voit, G. M., Weymann, R. J., & Korista, K. T. 1993, ApJ, 413, 95 [NASA ADS] [CrossRef] [Google Scholar]
- Watson, M. G., Schröder, A. C., Fyfe, D., et al. 2009, A&A, 493, 339 [NASA ADS] [CrossRef] [EDP Sciences] [Google Scholar]
- Wilms, J., Allen, A., & McCray, R. 2000, ApJ, 542, 914 [NASA ADS] [CrossRef] [Google Scholar]
All Tables
Line widths (FWHM) and shifts (uppermost 10 percent) of the strongest broad emission lines.
All Figures
|
Fig. 1 EPIC spectrum of PG 0043+039 from 2013 is shown in comparison to the best-fit power law absorbed by Galactic column density. Data are slightly binned, such that each bin contains at the minimum, two source counts. |
| In the text | |
|
Fig. 2 EPIC spectrum of PG 0043+039 from 2013 is shown in comparison to the best-fit power law absorbed by Galactic column density and intrinsic neutral absorption. Data are slightly binned, such that each bin contains, at the minimum, two source counts. |
| In the text | |
|
Fig. 3 EPIC spectrum of PG 0043+039 from 2013 shown in comparison to the best-fit intrinsic absorbed power law plus neutral iron line. Data are slightly binned, such that each bin contains, at the minimum, two source counts. |
| In the text | |
|
Fig. 4 EPIC spectrum of PG 0043+039 from 2013 shown in comparison to model assuming an absorbed primary power-law continuum and reflection on distant, optical thick material. Data are slightly binned, such that each bin contains, at the minimum, two source counts. |
| In the text | |
|
Fig. 5 HST-COS FUV spectrum of PG 0043+039 corrected for Galactic reddening. The brown line (see Paper I) shows an approximation of the continuum. Below the spectrum the locations of possible absorption lines are indicated. |
| In the text | |
|
Fig. 6 UV spectral variability: HST UV spectra of PG 0043+039 taken in the years 2013 (red) and in 1991, with flux multiplied by a factor 1.8 (black), as well as their difference spectrum (blue). |
| In the text | |
|
Fig. 7 Combined optical spectrum of PG 0043+039 taken with the HET and SALT telescopes in 2013. |
| In the text | |
|
Fig. 8 Optical variability: combined optical spectra of PG 0043+039 taken with the HET and SALT telescopes in 2013, an optical spectrum taken with the KPNO in 1990, as well as the difference between the spectra taken in 2013 and 1990 (additionally shifted by 0.6). A horizontal line is added to the difference spectrum to guide the eye. |
| In the text | |
|
Fig. 9 Possible absorption profiles belonging to the OVI, NV, SiIV, CIV, MgII, and Lyα lines. The profiles are divided by the assumed continuum. The velocity scale is calculated relative to the reddest line of each multiplet. The location of possible absorption lines, based on local minima, is indicated with the vertical tick marks at different velocities. |
| In the text | |
|
Fig. 10 Enlargement of the optical rest-frame spectrum around the narrow [O ii]λ3727 emission and CaII H and K absorption lines. The BAL I system (blue) consists of the CaH λ3968, CaK λ3934 lines (blueshifted by ~4900 km s-1) and the He i λ3889 line (blueshifted by ~5600 km s-1). |
| In the text | |
|
Fig. 11 Enlargement of the optical rest-frame spectrum around the intrinsic NaD absorption lines as well as around a possible blueshifted NaD absorption. |
| In the text | |
|
Fig. 12 Absorption lines of the BAL I system (CaH λ3968, CaK λ3934, and He i λ3889 lines) in velocity space. |
| In the text | |
|
Fig. 13 Combined optical-UV spectra of PG 0043+039, corrected for Galactic reddening, taken in the years 2013 (red lines) and 1990/1991 (blue lines). In addition the spectral OM data are given taken with the XMM-Newton satellite in 2005 (green data). Furthermore, the power-law continua to the UV and optical spectral ranges are shown. |
| In the text | |
|
Fig. 14 Combined overall spectrum (radio to hard X-ray) for PG 0043+039. |
| In the text | |
|
Fig. 15 Comparison of the UV emission line intensities in PG 0043+039 (upper panel) with respect to a composite HST/COS spectrum of 22 AGN (Shull et al. 2012, lower panel). We combined the two ultraviolet spectra of PG 0043+039 taken with the HST in the years 2013 and 1991. The UV line and continuum intensities increased by a factor of 1.8 between these two observations. We multiplied the UV spectral flux taken in 1991 with this factor to match the UV observations taken in 2013. The continua of both spectra are indicated as brown lines. |
| In the text | |
|
Fig. 16 Comparison of the relative UV emission line intensities in PG 0043+039 with respect to a composite HST/COS spectrum of 22 AGN (Shull et al. 2012). The continua have been subtracted first and both spectra are scaled to the same O viλ1038 and N vλ1243 line intensities. |
| In the text | |
|
Fig. 17 Combined ultraviolet spectra of PG 0043+039 taken with the HST 2013 and 1991. We indicate the identifications of the strongest UV emission lines, the geo-coronal lines, and both cyclotron systems B and A with their 3rd to 7th harmonics. The integer numbers identify the emission humps with multiple of the cyclotron fundamental. We indicate the power-law continuum Nν ~ να with α = 0.69 ± 0.02. The modeling of both cyclotron line systems B and A is given at the bottom. |
| In the text | |
|
Fig. 18 The αox gradient as a function of the monochromatic luminosity at rest-frame 2500 Å (upper panel) and the monochromatic luminosity at 2 keV versus the monochromatic luminosity at 2500 Å (lower panel). Black-filled circles indicate the SDSS objects with 0.1 ≤ z ≤ 4.5 from Strateva et al. (2005), while gray-filled circles label the data from Steffen et al. (2006). The dotted line represents the best fit to the sample of Steffen et al. (2006). Further measurements of extreme X-ray weak quasars are indicated with cyan circles (Saez et al. 2012). The positions of PG 0043+039 are highlighted for the years 2005 (red square) and 2013 (black circle). |
| In the text | |
Current usage metrics show cumulative count of Article Views (full-text article views including HTML views, PDF and ePub downloads, according to the available data) and Abstracts Views on Vision4Press platform.
Data correspond to usage on the plateform after 2015. The current usage metrics is available 48-96 hours after online publication and is updated daily on week days.
Initial download of the metrics may take a while.