Free Access
Fig. 16
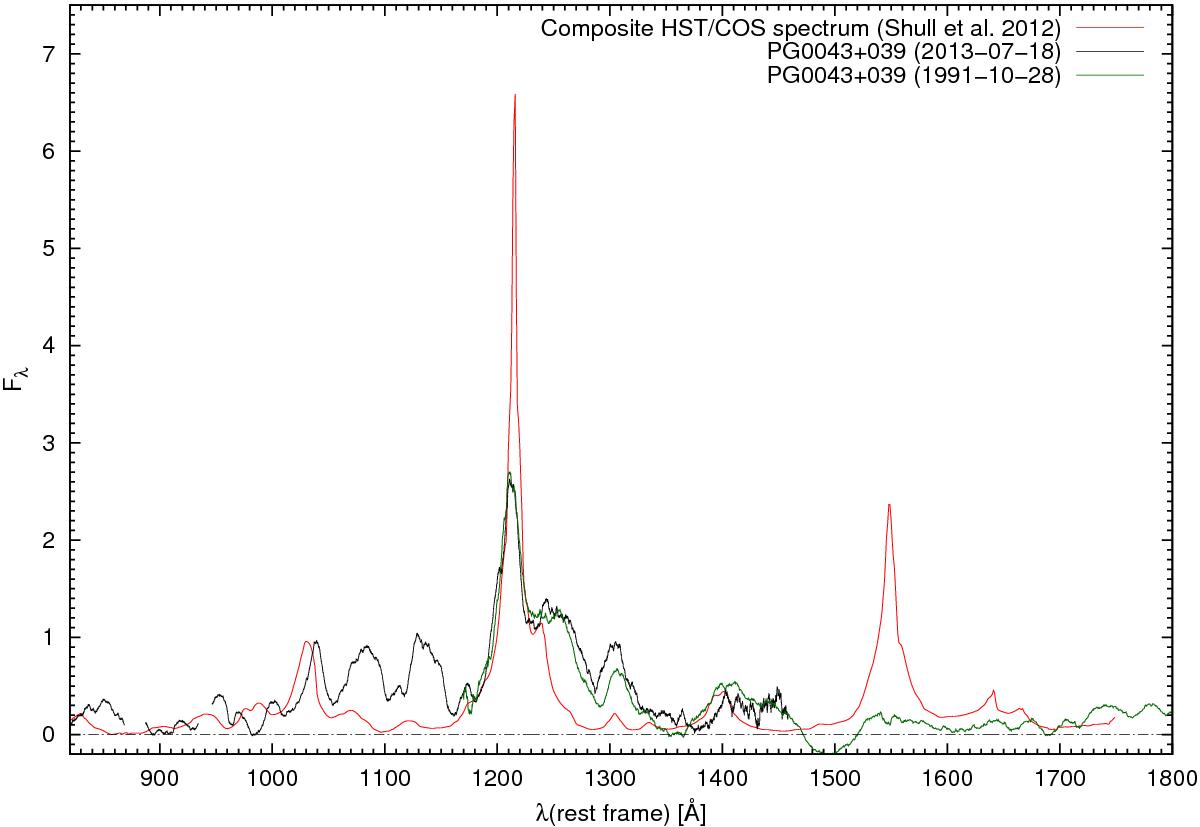
Comparison of the relative UV emission line intensities in PG 0043+039 with respect to a composite HST/COS spectrum of 22 AGN (Shull et al. 2012). The continua have been subtracted first and both spectra are scaled to the same O viλ1038 and N vλ1243 line intensities.
Current usage metrics show cumulative count of Article Views (full-text article views including HTML views, PDF and ePub downloads, according to the available data) and Abstracts Views on Vision4Press platform.
Data correspond to usage on the plateform after 2015. The current usage metrics is available 48-96 hours after online publication and is updated daily on week days.
Initial download of the metrics may take a while.