Fig. 18
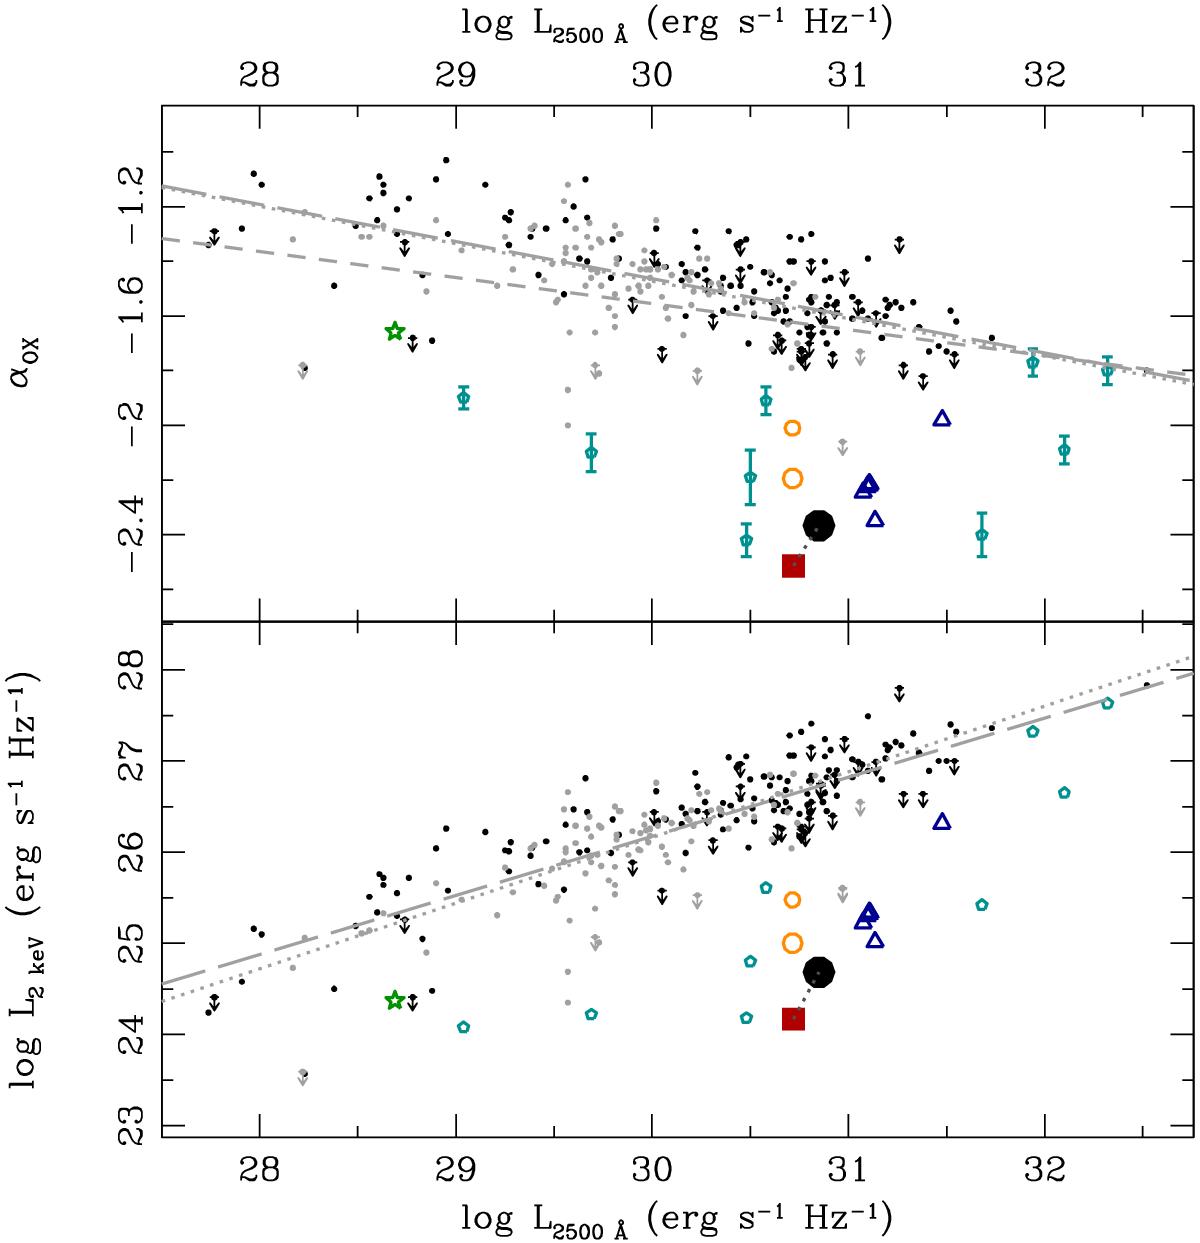
The αox gradient as a function of the monochromatic luminosity at rest-frame 2500 Å (upper panel) and the monochromatic luminosity at 2 keV versus the monochromatic luminosity at 2500 Å (lower panel). Black-filled circles indicate the SDSS objects with 0.1 ≤ z ≤ 4.5 from Strateva et al. (2005), while gray-filled circles label the data from Steffen et al. (2006). The dotted line represents the best fit to the sample of Steffen et al. (2006). Further measurements of extreme X-ray weak quasars are indicated with cyan circles (Saez et al. 2012). The positions of PG 0043+039 are highlighted for the years 2005 (red square) and 2013 (black circle).
Current usage metrics show cumulative count of Article Views (full-text article views including HTML views, PDF and ePub downloads, according to the available data) and Abstracts Views on Vision4Press platform.
Data correspond to usage on the plateform after 2015. The current usage metrics is available 48-96 hours after online publication and is updated daily on week days.
Initial download of the metrics may take a while.