| Issue |
A&A
Volume 585, January 2016
|
|
|---|---|---|
| Article Number | A59 | |
| Number of page(s) | 10 | |
| Section | Stellar structure and evolution | |
| DOI | https://doi.org/10.1051/0004-6361/201526747 | |
| Published online | 17 December 2015 | |
On the effects of rotation in primordial star-forming clouds
1
Instituto de Astrofisica e Ciencias do Espaco, Universidade de
Lisboa,
OAL, Tapada da Ajuda, PT,
1349-018
Lisboa,
Portugal
e-mail:
This email address is being protected from spambots. You need JavaScript enabled to view it.
2
Inter-University Centre for Astronomy and Astrophysics, Post Bag
4, Ganeshkhind, Pune University Campus, 411007
Pune,
India
Received: 15 June 2015
Accepted: 13 October 2015
Abstract
Context. The thermodynamical evolution of gas during the collapse of the primordial star-forming cloud depends significantly on the initial degree of rotation.
Aims. However, there is no clear understanding of how the initial rotation can affect the heating and cooling process and hence the temperature that leads to the fragmentation of the gas during Population III star formation.
Methods. We report the results from three-dimensional, smoothed-particle hydrodynamics (SPH) simulations of a rotating self-gravitating primordial gas cloud with a modified version of the Gadget-2 code, in which the initial ratio of the rotational to the gravitational energy (β0) is varied over two orders of magnitude.
Results. We find that despite the lack of any initial turbulence and magnetic fields in the clouds, the angular momentum distribution leads to the formation and build-up of a disk that fragments into several clumps. We further examine the behavior of the protostars that form in both idealized as well as more realistic minihalos from the cosmological simulations. The thermodynamical evolution and the fragmentation behavior of the cosmological minihalos are similar to that of the artificial cases, especially in those with a similar β0-parameter. Protostars with a higher rotation support exhibit spiral-arm-like structures on several scales, and have lower accretion rates. These type of clouds tend to fragment more, while some of the protostars escape from the cluster with the possibility of surviving until the present day. They also take much longer to form compared to their slowly rotating counterparts.
Conclusions. We conclude that the use of appropriate initial conditions of the gas in minihalos is a pivotal and decisive quantity to study the evolution and final fate of the primordial stars.
Key words: hydrodynamics / instabilities / early Universe / stars: Population III / stars: formation
© ESO, 2015
1. Introduction
Since the late 1960s, the theoretical study of the Universe at high redshift has persuaded a number of groups to work persistently on the dynamics of collapsing gas clouds (Saslaw & Zipoy 1967; Peebles & Dicke 1968; Silk 1977; Couchman & Rees 1986; Haiman et al. 1996; Tegmark et al. 1997), leading to the formation of the very first stars in the Universe, the so-called Population III (or Pop III) stars. Based on these leading-edge studies, the first sources of light are believed to have formed only a few hundred million years after the Big Bang (Barkana & Loeb 2001; Bromm & Larson 2004; Ciardi & Ferrara 2005). This era marks a crucial transition from the simple to the complex Universe (Loeb 2010; Bromm & Yoshida 2011; Glover 2013). Subsequent pioneering three-dimensional numerical simulations using adaptive mesh refinement (Abel et al. 2000; O’Shea & Norman 2006), smoothed-particle hydrodynamics (Yoshida et al. 2008) or more recently using the hydrodynamic moving mesh code Arepo (Greif et al. 2011, 2012) have led to the development of a widely accepted standard model of primordial star formation. In this star formation model, the first protostars form within dark matter (DM) halos with a virial temperature of ~1000 K and masses of ~105–106M⊙, which had collapsed at redshift z ≥ 20. However, other simulations show that Pop III stars may still form well beyond this, in waves that delay their formation (e.g., Scannapieco et al. 2003; Tornatore et al. 2007; Ritter et al. 2012). These studies suggest that Pop III star can continue to form down to the redshift z = 2.5 with a low peak rate of 10-5M⊙ yr-1 Mpc-3, which occurred at z = 6. Observational evidence of Pop III stars and the possibility of Pop III waves reaching lower redshifts has received a significant boost with the discovery of a luminous Lyman-α (Lyα) emitter with high EW He ii and Lyα emission and no metal lines (Sobral et al. 2015).
The hydrogen atoms combine with the free electron (present from the epoch of recombination at z ~ 1100) to produce small fractional abundances of H2, xH2 ~ 10-3 (Susa et al. 1998; Yoshida et al. 2003). As the collapse proceeds, the gas is cooled via H2 rotational and vibrational line emission (also termed as gas-phase reaction), with H− ion as an intermediate state (first discussed in the context of the local ISM by McDowell 1961)
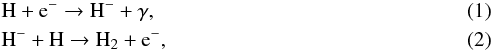
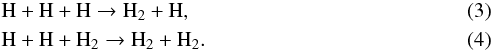
where the free electrons act as catalysts (Omukai & Nishi 1998). At this point, gas attains a temperature ~200 K, and is in local thermodynamical equilibrium (LTE) with the kinetic temperature of the gas. However, the limited H2 abundance is not sufficient to cool the gas further, and the gas begins to heat up with increasing density. This results in the free-fall time being shorter than the cooling time. The transition from the cooling (low density) to heating (high density) with increasing density occurs near a critical density ncr ≈ 104 cm-3, and sets a characteristic Jeans length, allowing the gas to fragment with the Jeans mass of MJ (200 K, 104cm-3) ~ 1000 M⊙ (Abel et al. 2002). At higher density (~108 cm-3) hydrogen molecules are formed by the three-body reactions (Palla et al. 1983)
There is however a significant uncertainty in the rate coefficients (Glover & Savin 2009) for the above set of reactions that can cool the gas rapidly by converting almost all the atomic hydrogen into molecules, making the gas chemothermally unstable (Turk et al. 2009; Dutta 2015a).
However, the amount of hydrogen molecules produced is a strong function of temperature. At high temperature, H2 molecules are destroyed by collisions with atomic H and H2 molecules (Yoshida et al. 2006),
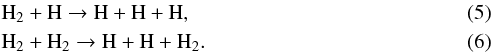
The collision dissociation of H2 prevents the fractional abundance (xH2) from becoming large. The study by Turk et al. (2011) has discussed the equilibrium condition between the abundances of atomic and molecular hydrogen, known as the principle of microscopic reversibility. Therefore the rate at which H2 is produced via the three-body reaction must be compensated by the destruction rate to bring the system to a chemical and thermal equilibrium, the abundances of which are related through the following well-known Saha equation: 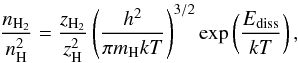 (7)where nH2 and nH are the number densities of molecular and atomic hydrogen, respectively, zH2 and zH are the partition functions of molecular and atomic hydrogen, Ediss is the dissociation energy of the hydrogen molecule, k is the Boltzmann constant, h is Planck’s constant, and T is the temperature. In LTE, the adopted values of the rate coefficient for the H2 collisional dissociation (kdiss) must be consistent with the three-body formation rate coefficient (kform) in the sense that each pair of rate coefficients satisfies the chemical equilibrium condition kform/kdiss = K, where K is the equilibrium constant.
Once the gas density reaches a value ~1010 cm-3, the cloud becomes optically thick to the strongest of H2 lines. Using the Sobolev approximation (as described in Yoshida et al. 2006), the H2 cooling rate in this regime can be expressed as  (8)where nu is the number density of the hydrogen molecules in upper energy level u; Aul is the spontaneous radiative transition rate, also known as Einstein coefficient, for a transition between u and l; hνul is the energy difference between u and l; and βesc,ul is the escape probability associated with this transition, i.e., the probability that the emitted photon can escape from the region of interest. In the high-density regime (~1014 cm-3), the gas goes through a phase of cooling instability due to a strong increase in the cooling rate by H2 collisional induced emission (CIE; see, e.g., Ripamonti & Abel 2004, for detailed discussion). Above the central density ~1016 cm-3, the gas becomes completely optically thick to the continuum radiation (Yoshida et al. 2008). At this point the remaining H2 dissociates via reactions (5,6), and hence cools the gas to collapse further. Once all the H2 dissociates, the gas becomes fully adiabatic with core mass ~0.01 M⊙ surrounded by a massive, dense envelope that accretes matter rapidly (Clark et al. 2011a).
The vanguard numerical simulations (e.g., Abel et al. 2002; Yoshida et al. 2006; Bromm et al. 2009) propose the formation of massive (typically ~20–50 M⊙) primordial protostars. This calculation result, however, contrasts with the present day star formation in which protostars with masses less than 1 M⊙ are formed (Kroupa 2002; Chabrier 2003). The recent improved and high resolution numerical simulations have inferred that the disk around the primordial core is unstable and fragments to form a small N system with low-mass stars, instead of a single protostar (e.g., Stacy et al. 2010; Clark et al. 2011; Hirano et al. 2014; Hartwig et al. 2015).
In the literature, there are appreciable indications that the collapsing cloud from which the protostar forms could have strong rotational support (Larson 1969, 1984). The cloud’s rotation can affect the dynamical as well as the thermal evolution of gas and consequenty determine the ensuing properties of the Pop III stars (Bodenheimer 1995; Matsumoto et al. 1997). The consequences of the cloud’s rotation on the chemical signature of the zero-metallicity primordial stars have been studied using stellar models (Meynet 2009, and references therein). With the use of the sink particle technique (discussed in Sect. 2) in the smoothed particle hydrodynamics (SPH) simulations, Stacy et al. (2011) have discussed the rotation velocity of the first stars, angular momentum transfer and the internal structure of the new-born protostars (see also Stacy et al. 2013, for the Arepo simulations). The central protostar rotates with a significant fraction of the Keplerian velocity. There is however scatter in the radial velocity, temperature, and accretion rate. In a recent study, Hirano et al. (2014) performed radiation hydrodynamical simulations to follow the evolution of 100 primordial protostars. Although their simulations were in 2D, they nicely compared the angular momentum of the cloud with the Pop III accretion rate. More recently, simulations and analytic models have shown the formation of the massive primordial stars in rapidly rotating disks in the presence of turbulence and UV backgrounds (Latif et al. 2013, and references therein). However, the extent to which the thermal and dynamical evolution of gas depends on the initial degree of rotation of the cloud has never been systematically tested. In addition, there is so far no clear understanding of how the cloud’s rotation can regulate the concurrent heating and cooling process during the collapse.
The dependence of the resultant fragmentation on the cloud’s initial rotation, however, has been shown in detail in previous studies (e.g., Machida et al. 2008b; Saigo et al. 2008). After performing a number of idealized numerical experiments, these parameterized studies have concluded that the formation of either binary or multiple systems depend highly on the initial rotation of the cloud. Nevertheless, these studies could not point out the influence on the thermal evolution of the primordial gas during collapse because their calculations adopted the model of equation of state (EOSs). In this work, we candidly scrutinize the role of initial rotation of the collapsing gas on the heating and cooling process that controls the chemothermal evolution of gas inside minihalos. In addition, we perform rigorous calculations in both the idealized as well as more realistic cosmological minihalos to thoroughly analyze the evolution of gas particles and their physical properties. This unique approach thus enables us to investigate in detail the thermal, chemical, and dynamical evolution of the baryonic matter in a full 3D simulation of Pop III collapse to understand better the physical process and the resulting fragmentation behavior that occurs once the first object is formed. Finally, we address important issues, such as the relation of the physical property and accretion phenomenon of the protostars on the initial rotation of the collapsing core. We also discuss the possibility of survival of Pop III stars until today.
The paper is organized in the following manner. In Sect. 2 we describe the numerical setup of the simulations and the initial conditions. In Sect. 3 we briefly discuss the relevant physical concepts of the problem with an emphasis on the heating and cooling process that determines the temperature evolution. The details of the velocity structure are outlined in Sect. 4. We discuss the accretion phenomenon comprehensively, followed by the implication of this study for the fragmentation of primordial gas in Sect. 5. The long-term evolution of protostars are contoured in Sect. 6. We summarize the main points and draw our conclusions in Sect. 7.
2. Simulations
In order to follow the gravitational collapse, one needs to ensure that the gas evolution in the simulations should not depend on the choice of minihalos. We therefore use two completely different numerical setups: minihalos from the cosmological simulations of Greif et al. (2011) obtained from the hydrodynamic moving mesh code Arepo (Springel 2010) and the artificial minihalos with an initially uniform density distribution of gas particles. In the following, we describe the initial condition and setup of the simulations.
To investigate the cosmological minihalos, we use snapshots at the epoch when the central number density is just below 106 cm-3, the onset of the crucial three-body H2 formation reaction. The mesh-generating points of Arepo can be interpreted as the Lagrangian fluid particles, which is the basic characteristic of the Gadget-2 SPH code (Springel 2005). At this time, the minihalos contain masses of 1030 M⊙ and 1093 M⊙ with maximum central temperature of 469 K and 436 K, respectively. The complete physical nature of these minihalos (e.g., number density (n), initial rotation (β0), maximum and minimum temperature, etc.) is summarized in Table 1. We use the Arepo output of these minihalos (MH-1 and MH-2 from Greif et al. 2011) as the initial conditions for our Gadget-2 implementation. Because of the conversion from the moving mesh to the SPH formalism (see, e.g., Smith et al. 2011; Dutta et al. 2015), we denote the minihalos as CH1 and CH2 for the Gadget-2 execution. The numerical resolution for CH1 and CH2 in SPH Gadget-2 simulations (for 100 SPH particles) is ~10-2M⊙.
For the artificial setup, we use the initial conditions that permit us to carry out a set of methodical numerical experiments. The randomly distributed gas particles have been settled using the periodic boundary conditions in a box. During this initial phase, we keep the gas temperature fixed and do not follow the primordial chemical network. Once the gas particles are settled, we are in a position to perform the simulations for the collapse of gas due to self-gravity.
The gas particles are initially uniformly distributed in a spherical cloud of size R0 ~ 2.7 pc and a total mass of M = 2982 M⊙. The number density is n = 103 cm-3 and the temperature T = 200 K. These initial conditions are equivalent to the primordial gas clumps that collapse (see, e.g., Abel et al. 2002; Yoshida et al. 2006). All clouds are modeled with 5 million SPH particles, and the mass of a single SPH particle is mSPH = 5.9 × 10⁻⁴M⊙. Therefore, the numerical resolution (roughly 100 SPH particles) is 0.06M⊙. The free-fall time for the uniform density distribution is  Myr and the sound crossing time is tsc ≈ 5 Myr. As the free-fall timescale is shorter than the sound-crossing timescale, the clouds immediately start to collapse under their self-gravity. The clouds are then given different degrees of solid body rotation and are not subject to the internal turbulent motions. The strength of rotational support can be described by the β0-parameter (Sterzik et al. 2003),
  (9)where Ω is the angular velocity, and Erot and Egrav are the magnitudes of the rotational and the gravitational energies, respectively. We perform ten different numerical experiments with β0 = 0.0, 0.005, 0.007, 0.01, 0.02, 0.04, 0.05, 0.07, 0.1, 0.2.
Physical properties of the cosmological minihalos are summarized.
As the collapse progresses in the central region of the cloud, it is extremely difficult to simulate the higher density regime because of shorter timescale. To overcome this problem, we use the sink particle technique in which the high-density region is replaced by a single sink particle with appropriate boundary conditions (see, e.g., Bate et al. 1995; Krumholz et al. 2004; Jappsen et al. 2005). The sink particle can then be assumed to be (or at least approximated by) a growing protostar. The density threshold for the sink particles to form is set as the number density of 5 × 1013 cm-3, at which point the gas has a temperature of ~1000 K. The sink particle can accrete gas particles within its accretion radius racc, which we fix at 6 AU, the Jeans radius at the density threshold for sink creation. The corresponding Jeans mass for both the cosmological as well as the artificial clumps is 0.06 M⊙, so we can resolve both the cosmological and artificial minihalos. The softening parameter of the sinks is 1.2 AU. In order to avoid spurious formation of new sink particles out of the gas, the sink particles is prevented further from forming within 2 racc of one another.
We follow Clark et al. (2011a) for the implementation of the external pressure term and a time-dependent primordial chemical network. To model a constant pressure boundary, we used a modified version of the Gadget 2 momentum equation, ![Mathematical equation: \begin{equation} \frac{{\rm d} v_{i}}{{\rm d} t} = - \sum_{j} m_{j} \left[ f_{i}\frac{P_{i}}{\rho_{i}^{2}} \nabla_{i} W_{ij}(h_{i}) + f_{j}\frac{P_{j}}{\rho_{j}^{2}}\nabla_{i} W_{ij}(h_{j}) \right] , \end{equation}](/articles/aa/full_html/2016/01/aa26747-15/aa26747-15-eq75.png) (10)where the contribution from the external pressure (Pext) is subtracted from both Pi and Pj (i.e., Pi and Pj are replaced by Pi − Pext and Pj − Pext, respectively). All quantities have their usual meaning. The chemical network includes primordial hydrogen, helium, and deuterium to model the chemical and thermal evolution of the metal-free gas inside minihalos. The details of all the chemical reactions are given in Glover & Abel (2008) and references therein. We adopt the intermediate three-body H2 rate coefficient 7.7 × 10⁻³¹T-0.464 cm6 s-1 proposed by Glover (2008).
(10)where the contribution from the external pressure (Pext) is subtracted from both Pi and Pj (i.e., Pi and Pj are replaced by Pi − Pext and Pj − Pext, respectively). All quantities have their usual meaning. The chemical network includes primordial hydrogen, helium, and deuterium to model the chemical and thermal evolution of the metal-free gas inside minihalos. The details of all the chemical reactions are given in Glover & Abel (2008) and references therein. We adopt the intermediate three-body H2 rate coefficient 7.7 × 10⁻³¹T-0.464 cm6 s-1 proposed by Glover (2008).
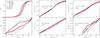 |
Fig. 1 Radial logarithmic binned, mass-weighted averages of the H2 fraction A), temperature B), and various heating and cooling rates (C) to F)) are plotted as a function of density for different degrees of initial rotation β0, just before the formation of the first sink. |
3. Heating and cooling rate
In this section, we investigate the cooling and heating mechanism associated with the emission, chemical reactions and gas contraction during the collapse of the cloud under its own gravity. The differences in the cooling and heating rates can force the gas to choose different paths for its thermodynamic evolution.
If we assume that the gas density (ρ) evolves with the free-fall time (tff) of the gas, i.e., dρ/dt = ρ/tff (see, e.g., Omukai 2000; Glover & Savin 2009), the thermal evolution can then be followed by solving the energy equation  (11)where ϵ is the energy per unit volume in the gas, and Λ and Γ are the cooling and heating rates, respectively, in units of erg s-1 cm-3. Figure 1 shows the physical conditions in the gas once the central region has collapsed to a density of ~5 × 1013 cm-3, i.e., just before the first sink formation. The panels show mass-weighted averages of the properties of individual SPH particles within the radial logarithmic bins.
The three-body H2 formation heating rate provides chemical heating associated with the release of 4.48 eV each time a H2 molecule forms. Because the H2-fractions are almost similar (Fig. 1A), there is no consequential effect of the three-body H2 heating on the cloud’s initial rotation (Fig. 1C). However, we find that there are substantial temperature differences between the clouds (Fig. 1B). For example, the temperature of the cloud with β = 0.2 is almost 40−60% lower than that with β0 = 0.005. This is because a higher degree of the rotational support slows down the contraction and reduces the amount of compressional heating (Fig. 1D). Thus, the cloud with β = 0.2 has a temperature of roughly T ≤ 200 K due to a slower collapse and, hence, less efficient compressional heating, whereas the temperature is nearly 1100 K in case of β = 0.0 or β = 0.005.
The rapid conversion of atomic to molecular hydrogen during the three-body reaction cools the gas less than the free-fall time and hence causes chemothermal instability (Dutta 2015a). At high densities the heating rate is as high as the line-cooling rate (Fig. 1E), however, again with slight differences over the range of β0 modeled. At equilibrium, the formation rate is balanced by the dissociation, and hence the dissociation cooling rate behaves in the same way with density as the heating rate. The dissociation cooling rate varies between clouds, with that for β0 = 0.005 nearly 10 orders of magnitude higher than for the β0 = 0.2 model (Fig. 1F) in the density range where the three-body reaction dominates. We therefore conclude that it is indeed the compressional heating (pdV) that determines the thermal evolution of gas, which strongly depends on the initial degree of rotation (β0).
At this point, it is worth pointing out that the temperature evolution of the cosmological minihalos are similar to that of the idealized cases. As expected, both CH1 (with β0 ≈ 0.035) and CH2 (with β0 ≈ 0.042) have the temperature variation that falls in between the highest and lowest β0 modeled throughout the density space. This also confirms that our varied parameter study with idealized clumps actually represents the cosmological initial conditions of the minihalos.
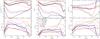 |
Fig. 2 Radial logarithmic binned, mass-weighted averages of the radial velocity A), rotational velocity B), radial velocity over sound speed C), rotational velocity over sound speed D), rotational velocity over Keplerian speed E), and radial velocity over rotational velocity are plotted as a function of radius, just before the first protostar forms. The initial strength of rotation introduces a scatter in the velocity. |
4. Velocity structure
In this section, we study the dynamics of the gas particles that can arise as a result of the chemical and thermal evolution of the clouds. We therefore take a closer look at the velocity of the gas associated with the cloud collapse. The radial profiles of the gas show the mass-weighted averages within logarithmic bins and are taken just before the formation of the first sink.
We find that there are considerable differences in radial velocities between the clouds (Fig. 2A). The radial velocity of the cloud with β0 = 0.005 is almost 30−40% higher than the cloud with β0 = 0.2. This is consistent with the fact that a lower rate of compressional heating for the gas of the collapsing core implies a lower radial velocity, which is nearly comparable with the sound speed (Fig. 2C).
In order to quantify the degree of rotational support, we plot the rotational velocity (Fig. 2B) and the ratio of the rotational velocity (vrot) to the Keplerian velocity (vKep), defined as  , where Menc(r) is the mass enclosed within the radius r (Fig. 2F). We find that the rotational speed for all β0 modeled is well below that required for rotational support by a factor of 5 to 7. This is consistent with previous cosmological simulations (e.g., Yoshida et al. 2008; Turk et al. 2009), which argued that the collapsing gas cloud has the ratio vrot/vKep ~ 0.5.
For the β0 = 0.2 case, the rotation speed varies between 0.3 and 0.9 times the Keplerian velocity, indicating that this cloud has gone through an efficient phase of angular momentum redistribution (Dutta 2015b). However, for β0> 0.05 the collapsing cloud is almost completely rotationally supported throughout and the gas at higher densities is relatively cold. All clouds are consequently sub-Keplerian, and the radial velocities for all clouds are comparable to the rotational velocities within 100 AU (Fig. 2E). From this discussion, we can infer that the cloud with higher rotation transfers the angular momentum more efficiently and hence becomes Keplerian in the outer regime of the collapsing core (for instance, vrot ~ vKep for r ≥ 104 AU for β0 = 0.2). Thus the outer regime, which is likely to form a Keplerian disk due to rotation, becomes unstable enough from accreting mass and, consequently, has higher chance to fragment (as we see in the next section). We conclude that the cloud’s initial rotation plays a pivotal role in the dynamical evolution of the gas by affecting the amount of rotational support even at later stages of the collapse.
5. Mass accretion and fragmentation
During collapse, the angular momentum is transported to smaller scales, resulting in the formation of rotationally supported disk-like structures (Stacy et al. 2011; Greif et al. 2012). However, the rotation is not sufficient to hold the collapse of the disk, which then fragments into multiple objects (Clark et al. 2011; Dutta et al. 2015). We thus gauge the accretion and gas instability carefully, as predicted by the properties of the gas, to check whether there is any hint of fragmentation already present before the formation of the first sink.
We follow Abel et al. (2002) to study the mass accretion rate, estimated as Ṁ(r) = 4 πr2ρ(r) vrad(r), as a function of radius for different degrees of initial rotation (Fig. 3A). We also define the accretion time, tacc = Menc(r) / 4 πρvradr2. For all simulations, Ṁ has a maximum at ~20−40 AU. Given that H2 line cooling becomes optically thick at the corresponding densities, Ṁ for all simulations converges in this range, as the gas looses its ability to cool efficiently. We would, however, like to point out that the scale, where dM/dt becomes maximum, may slightly change with the choice of density threshold for the sink formation. For example, if we choose n ~ 1015 cm-3 for a sink particle to form, the collapse of the inner structure proceeds and hence the mass accretion rate reaches a maximum at ~15−30 AU, depending on the initial degree of rotation. However, this is not a substantial issue compared to the overall thermal nature of the collapsing cloud. For slowly rotating clouds, the accretion rate is substantially higher (~0.1 yr-1) and the accretion time is on the order of free-fall time (Fig. 3C).
Since the collapsing core becomes Jeans unstable by accreting more and more mass, we check the strength of the gravitational instability by measuring the number of the Bonnor-Ebert masses (MBE) contained in the central dense volume (Ebert 1955; Bonnor 1956). We compute the Bonnor-Ebert masses as  (Abel et al. 2002), where cs is the sound speed, Pext is the external pressure that we assume to be equal to the local gas pressure, μ is the mean mass per particle, and γ = 5 / 3 is the adiabatic index, respectively. Within the central 104 AU regime, the enclosed gas mass for all values of β0 contains a roughly equal number of Bonnor-Ebert masses, although with a factor of two between the highest and lowest values of β0 (Fig. 3B). However, in the outer regime (i.e., r ≥ 104 AU), the clouds with β0 = 0.1 and β0 = 0.2 contain roughly 7 and 10 Bonnor-Ebert masses respectively. This is because the higher rotating clouds become close to Keplerian in the outer regime (as seen in the previous section) and tend to form a disk-like structure. As the higher rotation obstructs the infalling gas particles, the disk gradually accumulates enough Jeans masses through accretion and becomes gravitationally unstable to fragmentation.
Alongside the Bonnor-Ebert analysis, we also compare all relevant timescales associated with the cloud collapse. Figure 3C represents the accretion timescale (tacc) over free-fall timescale (tff). For a higher rotating cloud, the accretion time is much longer than the free-fall time. This is consistent with the above discussion and an alternate way to explain the mass accretion features of clouds with different β0-models shown in Fig. 3A. In Fig. 3D, we consider the fragmentation timescale, defined as tfrag ≡ MBE/Ṁ (e.g., Dopcke et al. 2013), and compare it with the free-fall timescale. We know that fragmentation generally occurs when the dynamical timescale of the central collapse becomes larger than the collapse timescale of individual density fluctuations. Here the free-fall timescale represents the dynamical timescale. In the outer regime (r ≥ 2 × 10⁴ AU), which is likely to form a disk, the fragmentation time becomes shorter than the free-fall time, especially for higher rotating clouds. We conclude here that the clouds with larger β0 collapse slowly from high rotation and tend to form a disk-like structure that becomes Keplerian and gravitationally unstable by accreting mass, heralding fragmentation.
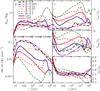 |
Fig. 3 Radial logarithmic binned, mass-weighted averages of the mass accretion rate A), the number of Bonnor-Ebert masses B), the accretion time over free-fall time C), the fragmentation time over free-fall time D), and the free-fall time over sound crossing time E) are plotted as a function of radius, just before the formation of the first sink. |
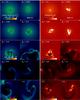 |
Fig. 4 Column density and column-weighted temperature distribution in a region of 2000 AU centered around the first protostar for different strengths of the initial rotation of the cloud are shown when a total of ~30 M⊙ have been converted into, or accreted onto, sink particles. |
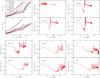 |
Fig. 5 Time evolution of the protostellar system: total mass of all the sink particles and the most massive sink particle are plotted as a function of time (top left). Total mass accretion rate by all sink particles are shown as a function of time (for others rotation parameter β0; same as Fig. 3A). The cloud with zero rotation attains 30 M⊙ within a few hundred years after the formation of the first sink particle. The rotationally supported cloud takes ~100−1000 yr, depending on the initial strength of rotation (β0). The mass accretion rate decreases with time until further sink particles form. |
6. Protostellar system
The study by Machida et al. (2008b) shows that any fragmentation only takes place after the disk formation, and that clouds with higher β0 tend to fragment at lower densities. We examine how the circumstellar accretion disk that formed in the idealized, as well as more realistic cosmological minihalos, becomes locally unstable and evolves for different degrees of initial rotation.
Figure 4 shows the column density and column-weighted temperature distribution in the inner 2000 AU at the end of the simulations. These images clearly reflect that all simulations fragment to form a small N-body system, comprised of secondary protostars, within the time in which ~30 M⊙ of material are accreted onto the sink particles. It is not surprising that clouds with a higher level of rotational support exhibit the disk-like structure on several scales within the central region, whereas slowly rotating clouds are more likely to be centrally condensed.
The top left panel of Fig. 5 shows the time evolution of the total mass accreted onto all the sinks (ΣM∗) and the maximum sink mass (M∗ max) in the period over which the sink formation occurs. We find that the cloud with zero rotation attains the 30 M⊙ within a few hundred years after the formation of the first sink particle, whereas rotationally supported clouds take ~100−1000 yr, depending on the initial strength of rotation. Figure 5 also shows the time evolution of the total mass accretion rate (dM∗/dt) onto all the sinks (same as Fig. 3A) for different values of β0. As expected, the mass accretion rate is larger for the slowly rotating clouds. In each case, dM∗/dt decreases with time until further sink particles form, and then the total accretion rate increases again, however, this time with large temporal variations. The mass accretion rate for the idealized cloud with β0 = 0.04 is similar to that of the cosmological minihalo CH2, which has a rotation parameter ~β0 = 0.042. This again confirms that our idealized clumps with varying β0 can actually be the representatives of cosmological initial conditions to investigate the thermodynamical evolution of gas and the resulting fragmentation behavior of the sinks.
Figure 6A shows the number of sinks for different values of β0, with rotationally supported clouds fragmenting the most. This is consistent with the recent study by Becerra et al. (2015), who have used Arepo simulations to investigate the dependence of the high accretion rate and efficient cooling of the gas on the fragmentation of the disk. However, Fig. 6A shows some scatter in the numbers, indicating the presence of statistical fluctuations that can be removed by pursuing more realizations to achieve a desired degree of accuracy. Figure 6B shows the time taken for all the clouds to accumulate ~30 M⊙. As expected, higher rotating clouds take longer compared to their slowly rotating counterparts. Figure 6C shows the distance at which the primordial protostars form from the center of the cloud. The red line represents the mean distances of all protostars (Rdist), which follows a power-law relationship with the cloud’s initial rotation,  . The protostars of the slowly rotating clouds form near the center (≤300 AU), while the others spread over larger distances of 5000 AU, as the conservation of angular momentum acts to move protostars to larger radii.
Another trend we find in our simulations is that a number of protostars are ejected from the central gas cloud, as seen in cosmological simulations (Greif et al. 2011). Although the resolution used in those studies was higher than our resolution, we still find ejection from the cluster. Figure 7 shows the radial velocity and the ratio of the radial velocity to the escape velocity for all protostars. The position of the sinks is measured from the center of mass of all the sinks. The escape velocity of the sinks is defined as 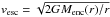 , where Menc(r) is the total mass (gas + sinks) that is enclosed within the radius r. The radial velocities of the sinks formed with lower β0 are below that required to be kicked out of the cluster. They tend to remain within the cluster and continue to accrete. For faster-rotating clouds, some protostars move from the cluster with radial velocities exceeding the escape velocity. There is, therefore, a greater chance that some protostars will be ejected, opening up the possibility that they could survive until the present day.
At this point we would like to point out that we have not mentioned the behavior of sinks for the β0 = 0.2 case. The thermodynamical evolution of this cloud is considerably different from other cases, so it is important to compare the fragmentation behavior of β0 = 0.2 cloud with others. However, because of very fast rotation it has been extremely tough to run the simulation up to the point where the total mass of all sinks reaches ~30 M⊙. The simulation with β0 = 0.2 stops much before compared to other simulations. For instance, simulation with β0 = 0.2 stops when the total mass of sinks is only around 3−4 M⊙ (and to reach up to that epoch of time; it takes around one month to run on a supercomputer that is based on graphical processing units, HPC–GPU Cluster Kolob). This is usually expected as the fast rotation can impede the collapse. We find a limiting value of β0 = 0.1 for the simulation to run up to the epoch when the mass of sinks attains a value of 30 M⊙. However, Figs. 4−7 still allow us to extrapolate and predict the expected results.
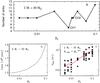 |
Fig. 6 Fragmentation behavior plotted for different degrees of initial rotation at the epoch when stellar system accretes ~30 M⊙. The number of sinks A), time taken to accrete ~30 M⊙B) and the position of the sinks (Rdist) from the center of mass is shown in C) as a function of the rotation parameter β0. |
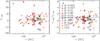 |
Fig. 7 Radial velocity A) and the ratio of the radial velocity to the escape velocity B) of sink particles for different values of β0 are plotted as a function of radius, at the epoch when the stellar system has accreted ≈30 M⊙. Some protostars with higher β0 move away from the cluster, with the radial velocity exceeding the escape velocity. |
7. Summary and discussion
We have minutely investigated the dependence of the thermodynamical evolution of primordial star-forming gas on the initial degree of rotation of the cloud, and analyzed its influence on the resulting fragmentation of the circumstellar accretion disk. For this purpose, we performed a set of three-dimensional hydrodynamical simulations of Pop III gas collapse to pursue a systematic parameter study, specified by β0, which spans two orders of magnitude for the amount of initial rotation, including two simulations runs with realistic cosmological initial conditions.
The cloud’s initial strength of rotation introduces a significant impact on the intricate combinations of the heating and cooling process, leading to a scatter in the temperature evolution of the collapsing gas. Clouds with slower rotation collapse faster and get heated as a result of the compressional heating. We also find that the dynamical evolution of the gas strongly depends on the initial strength rotation. Clouds with higher rotation form a Keplerian disk that becomes gravitationally unstable by accreting the infalling mass. Therefore, any change in the thermodynamical evolution introduces substantial difference in the number of Jeans mass, which determines the susceptibility to the fragmentation of the gas between the clouds with highest and lowest initial rotation.
In summary, a higher degree of rotation can hinder the infall, lead to a cooler gas, and result in more fragmentation. In addition, we find that the protostars with higher rotational support have larger spiral arms with lower accretion rates. We also point out that the newborn protostars are distributed in such a way to conserve the angular momentum, and some of them could have survived until today if they were of sufficiently low mass.
We conclude that the initial conditions of the primordial gas in the minihalos should be chosen scrupulously so as to simulate the long-term evolution and final fate of the primordial stars.
Despite considerable computational efforts involved, we emphasize that we cannot accurately predict the final mass of the primordial protostars. We have neglected the effect of the magnetic fields, which can be important in minihalos (Machida et al. 2008a; Sur et al. 2010; Schleicher et al. 2010). Recent cosmological simulations show the importance of the amplification of even small seed fields (Federrath et al. 2011; Schober et al. 2012). In addition, the radiative feedback can significantly affect the thermal as well as chemical evolution of the gas (Wise & Abel 2008; Whalen et al. 2010; Hosokawa et al. 2011), which is not included in our simulations. Notwithstanding, our approach to the problem enables us to provide good estimates for the overall trend of the accretion rate, thermodynamical evolution, and fragmentation behavior of gas in the rotating clouds in which we are particularly interested. Recent radiation hydrodynamic simulations (Hirano & Yoshida 2013; Greif 2014) demonstrated the effect of UV radiative feedback on the mass accretion, thus constraining the mass spectrum of the first stars (Susa 2013). Moreover, there is still a discrepancy regarding the three-body H2 rate coefficient (Turk et al. 2011; Bovino et al. 2014; Dutta et al. 2015). However, the recent study by Forrey (2013) provides the currently best available rate that is in good agreement with Palla et al. (1983) at high temperatures and Abel et al. (2002) at lower temperatures. It is therefore of strategic interest to accurately simulate the formation of the first stars in the Universe with the best available rates, inclusion of the magnetic fields, and radiative feedback in the next-generation avant-garde SPH codes.
Acknowledgments
The author wishes to thank Prateek Sharma, Biman Nath, David Sobral, and Dominik Schleicher for thoroughly checking the manuscript and for enormous constructive suggestions. The author also acknowledges Kazu Omukai, Athena Stacy, and the referee for helpful and worthwhile comments. The present work is supported by the Indian Space Research Organization (ISRO) grant (No. ISRO/RES/2/367/10-11) and Department of Science and Technology (DST) grant (Sr/S2/HEP-048/2012). The author is grateful to the Centre for Theoretical Studies (CTS) at the Indian Institutes of Technology – Kharagpur and Raman Research Institute for the financial support and hospitality. The author would also like to thank the Department of Physics, Indian Institute of Technology (Banaras Hindu University) at Varanasi and the Inter-University Center for Astronomy and Astrophysics (IUCAA) at Pune for local hospitality.
References
- Abel, T., Bryan, G. L., & Norman, M. L. 2000, ApJ, 540, 39 [NASA ADS] [CrossRef] [Google Scholar]
- Abel, T., Bryan, G. L., & Norman, M. L. 2002, Science, 295, 93 [NASA ADS] [CrossRef] [PubMed] [Google Scholar]
- Barkana, R., & Loeb, A. 2001, Phys. Rep., 349, 125 [NASA ADS] [CrossRef] [Google Scholar]
- Bate, M. R., Bonnell, I. A., & Price, N. M. 1995, MNRAS, 277, 362 [NASA ADS] [CrossRef] [Google Scholar]
- Becerra, F., Greif, T. H., Springel, V., & Hernquist, L. E. 2015, MNRAS, 446, 2380 [NASA ADS] [CrossRef] [Google Scholar]
- Bodenheimer, P. 1995, ARA&A, 33, 199 [NASA ADS] [CrossRef] [Google Scholar]
- Bonnor, W. B. 1956, MNRAS, 116, 351 [CrossRef] [Google Scholar]
- Bovino, S., Schleicher, D. R. G., & Grassi, T. 2014, A&A, 561, A13 [NASA ADS] [CrossRef] [EDP Sciences] [Google Scholar]
- Bromm, V., & Larson, R. B. 2004, ARA&A, 42, 79 [NASA ADS] [CrossRef] [EDP Sciences] [Google Scholar]
- Bromm, V., & Yoshida, N. 2011, ARA&A, 49, 373 [NASA ADS] [CrossRef] [Google Scholar]
- Bromm, V., Yoshida, N., Hernquist, L., & McKee, C. F. 2009, Nature, 459, 49 [NASA ADS] [CrossRef] [PubMed] [Google Scholar]
- Clark, P. C., Glover, S. C. O., Klessen, R. S., & Bromm, V. 2011a, ApJ, 727, 110 [NASA ADS] [CrossRef] [Google Scholar]
- Clark, P. C., Glover, S. C. O., Smith, R. J., et al. 2011b, Science, 331, 1040 [NASA ADS] [CrossRef] [PubMed] [Google Scholar]
- Chabrier, G. 2003, PASP, 115, 763 [NASA ADS] [CrossRef] [Google Scholar]
- Ciardi, B., & Ferrara, A. 2005, Space Sci. Rev., 116, 625 [NASA ADS] [CrossRef] [Google Scholar]
- Couchman, H. M. P., & Rees, M. J. 1986, MNRAS, 221, 53 [NASA ADS] [CrossRef] [Google Scholar]
- Dopcke, G., Glover, S. C. O., Clark, P. C., & Klessen, R. S. 2013, ApJ, 766, 103 [NASA ADS] [CrossRef] [Google Scholar]
- Dutta, J. 2015a, ApJ, 811, 98 [NASA ADS] [CrossRef] [Google Scholar]
- Dutta, J. 2015b, Astrophys. Space Sci., accepted [arXiv:1512.01656] [Google Scholar]
- Dutta, J, Nath, B. B., Clark, P. C., & Klessen, R. S. 2015, MNRAS, 450, 202 [NASA ADS] [CrossRef] [Google Scholar]
- Ebert, R. Z. 1955, Astrophysics, 37, 217 [Google Scholar]
- Federrath, C., Sur, S., Schleicher, D. R. G., Banerjee, R., & Klessen, R. S. 2011, ApJ, 731, 62 [NASA ADS] [CrossRef] [Google Scholar]
- Forrey, R. C. 2013, ApJ, 773, L25 [NASA ADS] [CrossRef] [Google Scholar]
- Glover, S. 2013, Astrophys. Space Sci. Libr., 396, 103 [NASA ADS] [CrossRef] [Google Scholar]
- Glover, S. C. O. 2008, in First Stars III, Chemistry and Cooling in Metal-Free and Metal-Poor Gas, eds. B. O’Shea, & A. Heger (New York: AIP), 990, 25 [Google Scholar]
- Glover, S. C. O., & Abel, T. 2008, MNRAS, 388, 1627 [NASA ADS] [CrossRef] [Google Scholar]
- Glover, S. C. O., & Savin, D. W. 2009, MNRAS, 393, 911 [NASA ADS] [CrossRef] [Google Scholar]
- Greif, T. H. 2014, MNRAS, 444, 1566 [NASA ADS] [CrossRef] [Google Scholar]
- Greif, T. H., Springel, V., White, S. D. M., et al. 2011, ApJ, 737, 75 [NASA ADS] [CrossRef] [Google Scholar]
- Greif, T. H., Bromm, V, Clark, P. C., et al. 2012, MNRAS, 424, 399 [NASA ADS] [CrossRef] [MathSciNet] [Google Scholar]
- Haiman, Z., Thoul, A. A., & Loeb, A. 1996, ApJ, 464, 523 [NASA ADS] [CrossRef] [Google Scholar]
- Hartwig, T., Clark, P. C., Glover, S. C. O., Klessen, R. S., & Sasaki, M. 2015, ApJ, 799, 114 [NASA ADS] [CrossRef] [Google Scholar]
- Hirano, S., & Yoshida, N. 2013, ApJ, 763, 52 [NASA ADS] [CrossRef] [Google Scholar]
- Hirano, S., Hosokawa, T., Yoshida, N., et al. 2014, ApJ, 781, 60 [NASA ADS] [CrossRef] [Google Scholar]
- Hosokawa, T., Omukai, K., Yoshida, N., & Yorke, H. W. 2011, Science, 334, 1250 [Google Scholar]
- Jappsen, A. K., Klessen, R. S., Larson, R. B., Li, Y., & Mac Low, M. M. 2005, A&A, 435, 611 [NASA ADS] [CrossRef] [EDP Sciences] [Google Scholar]
- Kroupa, P. 2002, Science, 295, 82 [NASA ADS] [CrossRef] [PubMed] [Google Scholar]
- Krumholz, M. R., McKee, C. F., & Klein, R. I. 2004, ApJ, 611, 399 [NASA ADS] [CrossRef] [Google Scholar]
- Larson, R. B. 1969, MNRAS, 145, L271 [CrossRef] [Google Scholar]
- Larson, R. B. 1984, MNRAS, 206, 197 [NASA ADS] [Google Scholar]
- Latif, M. A., Schleicher, D. R. G., Schmidt, W., & Niemeyer, J. 2013, ApJ, 772, L3 [NASA ADS] [CrossRef] [Google Scholar]
- Loeb, A. 2010, How Did the First Stars and Galaxies Form? (Princeton: Princeton Univ. Press) [Google Scholar]
- Machida, M. N., Matsumoto, T., & Inutsuka, S. 2008a, ApJ, 685 [Google Scholar]
- Machida, M. N., Omukai, K., Matsumoto, T., & Inutsuka, S. I. 2008b, ApJ, 677, 813 [NASA ADS] [CrossRef] [Google Scholar]
- Matsumoto, T., Hanawa, T., & Nakamura, F. 1997, ApJ, 478, 569 [NASA ADS] [CrossRef] [Google Scholar]
- McDowell, M. R. C. 1961, Observatory, 81, 240 [NASA ADS] [Google Scholar]
- Meynet, G. 2009, Lect. Notes Phys., 765, 139 [NASA ADS] [CrossRef] [Google Scholar]
- Omukai, K. 2000, ApJ, 534, 809 [NASA ADS] [CrossRef] [Google Scholar]
- Omukai, K., & Nishi, R. 1998, ApJ, 508, 141 [NASA ADS] [CrossRef] [Google Scholar]
- O’Shea, B. W., & Norman, M. L. 2006, ApJ, 648, 31 [NASA ADS] [CrossRef] [Google Scholar]
- Palla, F., Salpeter, E. E., & Stahler, S. W. 1983, ApJ, 271, 632 [NASA ADS] [CrossRef] [Google Scholar]
- Peebles, P. J. E., & Dicke, R. H. 1968, ApJ, 154, 891 [NASA ADS] [CrossRef] [Google Scholar]
- Ripamonti, E., & Abel, T. 2004, MNRAS, 348, 1019 [NASA ADS] [CrossRef] [Google Scholar]
- Ritter, J. S., Safranek-Shrader, C., Gnat, O., Milosavljevi, M., & Bromm, V. 2012, ApJ, 761, 56 [NASA ADS] [CrossRef] [Google Scholar]
- Saigo, K., Tomisaka, K., & Matsumoto, T. 2008, ApJ, 674, 997 [NASA ADS] [CrossRef] [Google Scholar]
- Saslaw, W. C., & Zipoy, D. 1967, Nature, 216, 976 [NASA ADS] [CrossRef] [Google Scholar]
- Scannapieco, E., Schneider, R., & Ferrara, A. 2003, ApJ, 589, 35 [NASA ADS] [CrossRef] [Google Scholar]
- Schleicher, D. R. G., Banerjee, R., Sur, S., et al. 2010, A&A, 522, A115 [NASA ADS] [CrossRef] [EDP Sciences] [Google Scholar]
- Schober, J., Schleicher, D. R. G., Federrath, C., et al. 2012, ApJ, 754, 99 [NASA ADS] [CrossRef] [Google Scholar]
- Silk, J. 1977, ApJ, 211, 638 [NASA ADS] [CrossRef] [Google Scholar]
- Smith, R. J., Glover, S. C. O., Clark, P. C., Greif, T., & Klessen, R. S. 2011, MNRAS, 414, 3633 [NASA ADS] [CrossRef] [Google Scholar]
- Sobral, D., Matthee, J., Darvish, B., et al. 2015, ApJ, 808, 139 [NASA ADS] [CrossRef] [Google Scholar]
- Springel, V. 2005, MNRAS, 364, 1105 [NASA ADS] [CrossRef] [Google Scholar]
- Springel, V. 2010, MNRAS, 401, 791 [NASA ADS] [CrossRef] [Google Scholar]
- Stacy, A., Greif, T. H., & Bromm, V. 2010, MNRAS, 403, 45 [NASA ADS] [CrossRef] [Google Scholar]
- Stacy, A., Bromm, V., & Loeb, A. 2011, MNRAS, 413, 543 [NASA ADS] [CrossRef] [Google Scholar]
- Stacy, A., Greif, T. H., Klessen, R. S., Bromm, V., & Loeb, A. 2013, MNRAS, 431, 1470 [NASA ADS] [CrossRef] [Google Scholar]
- Sterzik, M. F., Durisen, H., & Zinnecker, H. 2003, A&A, 411, 91 [NASA ADS] [CrossRef] [EDP Sciences] [Google Scholar]
- Sur, S., Schleicher, D. R. G., Banerjee, R., Federrath, C., & Klessen, R. S. 2010, ApJ, 721, L134 [NASA ADS] [CrossRef] [Google Scholar]
- Susa, H. 2013, ApJ, 773, 185 [NASA ADS] [CrossRef] [Google Scholar]
- Susa, H., Uehara, H., Nishi, R., & Yamada, M. 1998, Progr. Theor. Phys., 100, 63 [Google Scholar]
- Tegmark, M., Silk, J., Rees, M. J., et al. 1997, ApJ, 474, 1 [NASA ADS] [CrossRef] [Google Scholar]
- Tornatore, L., Ferrara, A., & Schneider, R. 2007, MNRAS, 382, 945 [NASA ADS] [CrossRef] [Google Scholar]
- Turk, M. J., Abel, T., & O’Shea, B. W. 2009, Science, 325, 601 [NASA ADS] [CrossRef] [PubMed] [Google Scholar]
- Turk, M. J., Clark, P. C., Glover, S. C. O., et al. 2011, ApJ, 726 [Google Scholar]
- Whalen, D, Hueckstaedt, M., & McConkie, O. 2010, ApJ, 712, 101 [NASA ADS] [CrossRef] [Google Scholar]
- Wise, J. H., & Abel, T. 2008, ApJ, 685, 40 [NASA ADS] [CrossRef] [Google Scholar]
- Yoshida, N., Abel, T., Hernquist, L., & Sugiyama, N. 2003, ApJ, 592, 645 [NASA ADS] [CrossRef] [Google Scholar]
- Yoshida, N., Omukai, K., Hernquist, L., & Abel, T. 2006, ApJ, 652 [Google Scholar]
- Yoshida, N., Omukai, K., & Hernquist, L. 2008, Science, 321, 669 [NASA ADS] [CrossRef] [PubMed] [Google Scholar]
All Tables
All Figures
|
Fig. 1 Radial logarithmic binned, mass-weighted averages of the H2 fraction A), temperature B), and various heating and cooling rates (C) to F)) are plotted as a function of density for different degrees of initial rotation β0, just before the formation of the first sink. |
| In the text | |
|
Fig. 2 Radial logarithmic binned, mass-weighted averages of the radial velocity A), rotational velocity B), radial velocity over sound speed C), rotational velocity over sound speed D), rotational velocity over Keplerian speed E), and radial velocity over rotational velocity are plotted as a function of radius, just before the first protostar forms. The initial strength of rotation introduces a scatter in the velocity. |
| In the text | |
|
Fig. 3 Radial logarithmic binned, mass-weighted averages of the mass accretion rate A), the number of Bonnor-Ebert masses B), the accretion time over free-fall time C), the fragmentation time over free-fall time D), and the free-fall time over sound crossing time E) are plotted as a function of radius, just before the formation of the first sink. |
| In the text | |
|
Fig. 4 Column density and column-weighted temperature distribution in a region of 2000 AU centered around the first protostar for different strengths of the initial rotation of the cloud are shown when a total of ~30 M⊙ have been converted into, or accreted onto, sink particles. |
| In the text | |
|
Fig. 5 Time evolution of the protostellar system: total mass of all the sink particles and the most massive sink particle are plotted as a function of time (top left). Total mass accretion rate by all sink particles are shown as a function of time (for others rotation parameter β0; same as Fig. 3A). The cloud with zero rotation attains 30 M⊙ within a few hundred years after the formation of the first sink particle. The rotationally supported cloud takes ~100−1000 yr, depending on the initial strength of rotation (β0). The mass accretion rate decreases with time until further sink particles form. |
| In the text | |
|
Fig. 6 Fragmentation behavior plotted for different degrees of initial rotation at the epoch when stellar system accretes ~30 M⊙. The number of sinks A), time taken to accrete ~30 M⊙B) and the position of the sinks (Rdist) from the center of mass is shown in C) as a function of the rotation parameter β0. |
| In the text | |
|
Fig. 7 Radial velocity A) and the ratio of the radial velocity to the escape velocity B) of sink particles for different values of β0 are plotted as a function of radius, at the epoch when the stellar system has accreted ≈30 M⊙. Some protostars with higher β0 move away from the cluster, with the radial velocity exceeding the escape velocity. |
| In the text | |
Current usage metrics show cumulative count of Article Views (full-text article views including HTML views, PDF and ePub downloads, according to the available data) and Abstracts Views on Vision4Press platform.
Data correspond to usage on the plateform after 2015. The current usage metrics is available 48-96 hours after online publication and is updated daily on week days.
Initial download of the metrics may take a while.