Free Access
Fig. 4

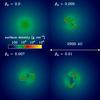
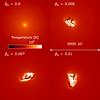
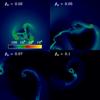
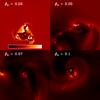
Column density and column-weighted temperature distribution in a region of 2000 AU centered around the first protostar for different strengths of the initial rotation of the cloud are shown when a total of ~30 M⊙ have been converted into, or accreted onto, sink particles.
This figure is made of several images, please see below:
Current usage metrics show cumulative count of Article Views (full-text article views including HTML views, PDF and ePub downloads, according to the available data) and Abstracts Views on Vision4Press platform.
Data correspond to usage on the plateform after 2015. The current usage metrics is available 48-96 hours after online publication and is updated daily on week days.
Initial download of the metrics may take a while.