| Issue |
A&A
Volume 584, December 2015
|
|
|---|---|---|
| Article Number | A19 | |
| Number of page(s) | 9 | |
| Section | Stellar atmospheres | |
| DOI | https://doi.org/10.1051/0004-6361/201527261 | |
| Published online | 13 November 2015 | |
Analysis of HST/COS spectra of the bare C–O stellar core H1504+65 and a high-velocity twin in the Galactic halo ⋆
Institute for Astronomy and Astrophysics, Kepler Center for Astro and
Particle Physics, Eberhard Karls Universität Tübingen,
Sand 1,
72076
Tübingen,
Germany
e-mail:
This email address is being protected from spambots. You need JavaScript enabled to view it.
Received: 27 August 2015
Accepted: 24 September 2015
Abstract
H1504+65 is an extremely hot white dwarf (effective temperature Teff = 200 000 K) with a carbon-oxygen dominated atmosphere devoid of hydrogen and helium. This atmospheric composition was hitherto unique among hot white dwarfs (WDs), and it could be related to recently detected cooler WDs with C or O dominated spectra. The origin of the H and He deficiency in H1504+65 is unclear. To further assess this problem, we performed ultraviolet spectroscopy with the Cosmic Origins Spectrograph (COS) aboard the Hubble Space Telescope (HST). In accordance with previous far-ultraviolet spectroscopy performed with the Far Ultraviolet Spectroscopic Explorer, the most prominent lines stem from C iv, O v–vi, and Ne vi–viii. Archival HST/COS spectra are utilized to prove that the supersoft X-ray source RX J0439.8−6809 is, considering the exotic composition, a twin of H1504+65 that is even hotter (Teff = 250 000 K). In contrast to earlier claims, we find that the star is not located in the Large Magellanic Cloud but a foreground object in the Galactic halo at a distance of 9.2 kpc, 5.6 kpc below the Galactic plane, receding with vrad = +220 km s-1.
Key words: stars: abundances / stars: atmospheres / stars: evolution / stars: AGB and post-AGB / white dwarfs
Based on observations with the NASA/ESA Hubble Space Telescope, obtained at the Space Telescope Science Institute, which is operated by the Association of Universities for Research in Astronomy, Inc., under NASA contract NAS5-26666.
© ESO, 2015
1. Introduction
H1504+65 was discovered as a very bright soft X-ray source by HEAO11 (Nugent et al. 1983) and its blue optical counterpart was detected by Nousek et al. (1986). It was argued that the source is an extremely hot white dwarf (Teff = 160 000 ± 30 000 K and surface gravity log (g/cm s-2) = 7.5 ± 0.5) that is devoid of hydrogen and helium, due to the lack of respective lines in the optical spectrum. Non-local thermodynamic equilibrium (non-LTE) modeling of ultraviolet (UV) and optical spectra proved the high temperature and showed that the atmosphere is mainly composed by carbon and oxygen in equal amounts (Werner 1991). Over the years, substantial efforts were made with subsequent spectroscopy in the soft X-ray range (with EUVE2 and Chandra observatories), in the UV (HUT3, FUSE4, HST5), and in the optical with large ground-based telescopes (Werner & Wolff 1999; Werner et al. 2004a,b, 2007, 2010), leading to tight constraints on effective temperature and gravity (Teff = 200 000 ± 20 000 K, log g= 8.0 ± 0.5) and the detection of high amounts of neon (2–5%, by mass) and magnesium (2%) as well as iron at solar abundance level. High-resolution UV spectroscopy presented in the paper at hand was performed with the aim to further constrain the trace element abundances and to shed more light on the origin of the exotic composition of H1504+65.
Spectroscopically, H1504+65 was classified as a PG 1159 star, denoting hot (Teff = 75 000–200 000 K), hydrogen-deficient (pre-) white dwarfs (WDs) that suffered a late helium-shell flash, causing He-C dominated atmospheres with high admixtures of oxygen (He = 0.30–0.85, C = 0.13–0.60, O = 0.02–0.20, Werner & Herwig 2006). H1504+65 is an extreme member of this class because of its helium-deficiency (He < 0.01, C = 0.5, O = 0.5). We argued that the extreme abundances are perhaps the consequence of additional, strong mass-loss, eroding the star down to its C–O core or, alternatively, that the star is the result of a binary WD merger. It could also be that this most massive known PG 1159 star ( ) emerged from a relatively massive main sequence star (8–10 M⊙) that evolved into a carbon-burning super-AGB star (e.g., García-Berro et al. 1997; Doherty et al. 2015; Woosley & Heger 2015).
As to its future evolution, we speculated that H1504+65 – should it have retained traces of helium in its envelope – would evolve into a pure-He atmosphere (DB) WD and later into a DQ WD that exhibits traces of C due to dredge-up by a thin, convective He-envelope (Koester et al. 1982). More drastic examples for possible cooled-down versions of H1504+65 were found recently, namely the so-called hot DQ WDs (Teff = 18 000–24 000 K, Dufour et al. 2007, 2011) with carbon-dominated atmospheres. In addition, helium-dominated WDs with O-rich atmospheres were discovered and they are interpreted as almost naked O-Ne stellar cores (Teff ≈ 10 000 K, Gänsicke et al. 2010; Kepler et al. 2015).
Although the number of known PG 1159 stars has increased to about fifty in the recent years, mainly due to the Sloan Digital Sky Survey (Werner et al. 2014), H1504+65 remained a unique object. However, since some time another soft X-ray source was suspected to be a similar object. RX J0439.8−6809 was discovered by ROSAT and classified as a persistent supersoft X-ray source most probably located in the Large Magellanic Cloud (LMC, Greiner et al. 1994) and the blue optical counterpart was detected by van Teeseling et al. (1996). The spectral energy distribution was found to be consistent with a WD with Teff ≈ 300 000 K. A UV spectrum taken by van Teeseling et al. (1999) with HST/STIS6 is rather featureless. No flux variability was detected. It was argued that the source is either a supersoft X-ray binary powered by stable nuclear shell burning or a single hot pre-WD approaching the WD cooling sequence. The idea that the source might be similar to H1504+65 was corroborated by optical spectroscopy (Reinsch et al. 2002) that revealed, among others, O vi emission lines. They were found redshifted by 250 ± 30 km s-1.
In the following, we describe the HST observations (Sect. 2) and model atmospheres (Sect. 3) utilized for the spectral analysis that is presented in Sects. 4 and 5 for H1504+65 and RX J0439.8−6809, respectively. Stellar parameters and distances are derived in Sect. 6. We summarize the results and conclude in Sect. 7.
Observation log of HST/COS spectroscopy of H1504+65 and RX J0439.8−6809.
2. Observations
HST far-ultraviolet spectroscopy of H1504+65 with the Cosmic Origins Spectrograph (COS) using gratings G130M and G160M at central wavelength settings 1291 and 1600 Å, respectively, was performed during Cycle 17. It was conducted during two consecutive orbits on May 25, 2010. Table 1 summarizes the observations. The resolving power λ/ Δλ of the G130M and G160M gratings across the observed wavelength ranges is 15 000–19 000 and 15 000–21 000, respectively, corresponding to Δλ ≈ 0.08 and 0.09 Å, respectively. The spectra were corrected for the radial velocity of the star (+44 ± 4 km s-1) for the comparison with our synthetic spectra. As measured from the Lyman α wings, the hydrogen column density toward H1504+65 is NH I = 6.0 × 1019 cm-2, identical with a result from previous HUT observations (Kruk & Werner 1998). The spectrum is displayed in Fig. 1.
The HST/COS spectrum of RX J0439.8−6809 was retrieved from the MAST archive (Proposal ID 13289). The observation was performed on Jan. 10, 2014 with the G130M grating in the same setup like our observation of H1504+65, with an exposure time of 14 080 s, however, only for one central wavelength setting (1291 Å). The spectrum was corrected for the radial velocity of the star (vrad = +220 ± 10 km s-1) for the comparison with synthetic spectra. This velocity is consistent with that measured from optical spectra (+250 ± 30 km s-1, see Introduction) and is close to the radial velocity of the LMC (+262 km s-1, McConnachie 2012). The low-ionisation interstellar absorption lines (C ii, Si ii, S ii, Fe ii) have vrad = +8 ± 5 km s-1). The strongest of them display a second, much weaker velocity component with vrad = +150 ± 10 km s-1 which probably stems from a high-velocity cloud in the Galactic halo (see, e.g., Richter et al. 1999; Smoker et al. 2015). Such high-velocity interstellar components are not uncommon in UV spectra of very hot pre-WDs, as for instance encountered in a recent study of four H-deficient objects with distances 2–8 kpc (Reindl et al. 2014). One of it (HS 1522+6615) is a halo object 7.9 kpc away (5.5 kpc from the Galactic plane) having a high radial velocity of −180 km s-1.
The spectrum of RX J0439.8−6809 is contaminated by strong airglow lines. Besides Lyman α, there are strong emissions from N i (at 1134/1135 and 1200 Å) and O i (at 1302/1306 and 1356/1358 Å); see the airglow line table on the COS instrument page7. As measured from the Lyman α wings, the interstellar hydrogen column density toward RX J0439.8−6809 is NH I = 3.5 × 1020 cm-2, consistent with the previous result from a HST/STIS observation (4 × 1020 cm-2, van Teeseling et al. 1999). The spectrum is displayed in Fig. 2.
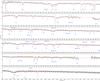 |
Fig. 1 HST/COS spectrum of H1504+65 and a model (Teff = 200 000 K, log g= 8, C = 0.46, O = 0.46, Ne = 0.06, Mg = 0.02). Observation and model were folded with 0.02 Å and 0.1 Å Gaussians, respectively. Unidentified photospheric lines are marked with “?”. Other observed narrow lines are of interstellar origin (the strongest are marked with circles). “λ?” denotes lines in the model with uncertain wavelength position. |
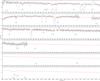 |
Fig. 2 HST/COS spectrum of RX J0439.8−6809 and a model (Teff = 250 000 K, log g= 8, C = 0.495, O = 0.495, Ne = 0.01). Observation and model were folded with 0.05 Å and 0.1 Å Gaussians, respectively. Unidentified photospheric lines are marked with “?”. Other observed narrow lines are of interstellar origin (the strongest are marked with circles). |
3. Model atoms and model atmospheres
For the spectral analysis we used our non-LTE code TMAP8 (Werner et al. 2012) to compute plane-parallel, line-blanketed atmosphere models in radiative and hydrostatic equilibrium (Werner & Dreizler 1999; Werner et al. 2003). They include the three most abundant elements in H1504+65, namely, C, O, and Ne. Five more species (N, Mg, Si, Ca, Fe) were investigated and treated one by one as trace elements, i.e., keeping fixed the atmospheric structure. In the same manner, an extended model atom for Ne was introduced, meaning that non-LTE population numbers were also computed for highly-excited levels that were treated in LTE during the preceding model-atmosphere computations. Table 2 summarizes the number of considered non-LTE levels and radiative transitions between them. All model atoms were built from the publicly available Tübingen Model Atom Database (TMAD9), comprising data from different sources, namely Bashkin & Stoner (1975), the databases of the National Institute of Standards and Technology (NIST10), the Opacity Project (OP11, Seaton et al. 1994), the IRON project (Hummer et al. 1993), CHIANTI12 (Dere et al. 1997; Landi et al. 2013), as well as the Kentucky Atomic Line List13.
For iron, we used a statistical approach employing typically seven superlevels per ion linked by superlines, together with an opacity sampling method (Anderson 1989; Rauch & Deetjen 2003). Ionisation stages VII–IX augmented by a single, ground-level stage X were considered per species. We used the complete line list of Kurucz (so-called LIN lists, comprising about 2.6 × 10⁵ lines of the considered ions; Kurucz 1991, 2009, 2011) for the computation of the non-LTE population numbers, and the so-called POS lists (that include only the subset of lines with precisely known, experimentally observed line positions) for the final spectrum synthesis.
Number of levels and lines of model ions used for line formation calculations of metals.
4. Line identifications and spectral fitting for H1504+65
Generally, our new HST/COS spectrum is dominated by lines from C iv and O vi that are well known from, e.g, the PG 1159 prototype PG 1159−035 (Jahn et al. 2007). In addition, we see lines from Ne vi-viii. A complete list of identified lines is given in Table 3.
In the following, we present a detailed description of the spectrum and our line fitting procedure. We began our analysis with a reference model having literature values: Teff = 200 000 K, log g= 8, and a C/O ratio of unity. It turned out that this model already matches very well the observation. In particular the neon and oxygen ionisation balances confirm the temperature within the previous error range (± 20 000 K). There is no necessity to revise the C/O ratio or the surface gravity.
4.1. Carbon
The depth of the C iv resonance doublet is not quite achieved by the 200 000 K model and would favor a slightly lower temperature (180 000 K). But then the low ionisation features of oxygen (O v 1371 Å) and neon (Ne vi lines) become mildly too deep, while the Ne viii lines become too weak. The other C iv lines match well with the exception of the 1198 and 1230 Å lines, whose wings were significantly too broad. This fact highlights a general problem with the line broadening theory. Usually, the subordinate C iv (and O vi) line profiles are well described by an approximate treatment for linear Stark broadening, because they are one-electron systems. This approximation is good for lines involving levels with high principal and angular quantum numbers (n and l), because the levels are nearly degenerate. For low-l and low-n levels this treatment becomes questionable. The 1198 and 1230 Å lines are such cases, they are the 3d–4p and 3p–4s transitions, respectively, while on the other hand the 3d–4f transition at 1169 Å involving the high-l 4f level, is matched quite well by the model (note that the depression in its blue wing is probably due to an unidentified line). We now treat the 1198 and 1230 Å lines with quadratic Stark effect and indeed, they fit the observations much better.
4.2. Nitrogen
From the lack of the N v 1239/1243 Å resonance doublet we can infer an upper limit of N < 3.0 × 10⁻⁵, which is much tighter than than the previous limit derived from the absence of optical N v emission lines (< 5.0 × 10⁻³, Werner 1991).
4.3. Oxygen
The detection of the O v 1371 Å line is important because it is very temperature sensitive. Its profile is best matched by a Teff = 200 000 K model while a model with 180 000 K has a profile definitely too deep and in a 220 000 K model the line has vanished.
We found that the Ritz wavelengths of the O vi 5s–7p doublet (1191.34 and 1191.30 Å) must be reduced by 0.5 Å to match the observed wavelengths, indicative of inaccuracies in the level energies in the atomic databases utilized. Similar corrections for a number of other UV O vi lines were made by Jahn et al. (2007) using the spectra of several PG 1159 stars (see their Table 6).
4.4. Neon
Neon lines of three ionisation stages (Ne vi-viii) can be identified. Our models predict a very strong Ne vi line at 1223.3 Å from the transition 5d 2D−7f 2Fo which is not present in the observation. The line was computed with an f-value from OP and NIST level energies. The upper level, however, is marked as “may not be real”, so in fact the transition might not exist at all. Consequently, we omitted it from our synthetic spectra.
The next strongest Ne vi lines in our models are the 2s2p3d 2Fo−2s25g 2G doublet at 1272 Å. According to Kramida et al. (1999), they are located at a single observed wavelength (1271.8 ± 1.5 Å) but two (computed) Ritz wavelengths (1270.2/1272.8 ± 0.5 Å) and both components have the same strength. In the H1504+65 spectrum is one strong line at 1270.3 Å plus two nearby, weaker ones with similar strength at 1269.3 and 1271.6 Å. The latter ones might be assigned to the modeled doublet because their spacing of 2.3 Å is similar to that of the Ritz wavelengths (2.6 Å) although the absolute differences (0.9 and 1.2 Å) are about twice the quoted uncertainty of 0.5 Å. Another possibility is that the doublet spacing computed by Kramida et al. (1999) is overestimated and indeed unresolvable in the H1504+65 spectrum. The strong feature at 1270.3 Å coincides with the (unresolved) laboratory measurement of Kramida et al. (1999) at 1271.8 Å within its 1.5 Å uncertainty. This is also favored by the fact that the total equivalent width of the doublet better fits that strong feature in H1504+65 than the significantly weaker other lines. Another Ne vi multiplet at 1645–1680 Å is much weaker but the wavelengths of the components are well known (±0.03 Å, Kramida et al. 1999) and the strongest components are detectable in the observation.
As to Ne vii, our models predict many lines, however, due to uncertain level energies their positions are not known sufficiently well to be assigned to any of the unidentified observed lines. The only line of this ion with accurately known wavelength is an intercombination line at 1319.71 Å, and it can be identified in the observed spectrum. A triplet in our synthetic spectrum at 1560–1571 Å might be assigned to nearby absorption lines in the observation with differences of about 1 Å.
The broad absorption trough at 1162–1166 Å stems from numerous Ne viii lines (Werner et al. 2007).
The presence of lines from three ionisation stages of neon offers a particularly strong constraint on Teff . We confirm our earlier result of Teff = 200 000 ± 20 000 K. The neon abundance is best matched with a model having Ne = 0.06, being consistent with, though higher than, earlier results.
4.5. Silicon
At Teff = 200 000 K, silicon lines with accurately known wavelengths from ionisation stages Si v-vi are predicted by the models. Among the strongest ones are, for example, Si v 1251.39 and Si vi 1229.01 Å. None of them is identified in the observation. In addition, Si vii lines are also predicted (e.g., at 1236 Å), however, their wavelengths are uncertain by up to 1 Å. Nevertheless, no possible counterparts are detectable in the observation. We derive an upper abundance limit of Si < 2.6 × 10⁻³, which is four times the solar value. An unidentified line at 1148.6 Å is well matched by a Si vi 4P−4Do line in the model with this abundance, however, perhaps by chance coincidence because the wavelength is known only within ±0.12 Å and another line of this multiplet at 1152.8 Å is not unambiguously detected.
4.6. Magnesium
We searched for Mg lines without success. According to our models, Mg vii has the strongest lines, however, wavelength positions are not known better than about 1–2 Å. At the abundance Mg = 0.02 derived from the Chandra soft-X-ray spectrum (Werner et al. 2004b), UV lines of significant strength (up to 15% central depression) are predicted, most prominently the components of a 3Po−3P triplet at 1291–1350 Å. Hence, some of the unidentified lines could stem from this ion.
4.7. Calcium
The strongest line predicted by our models is Ca x 1159.2 Å, a component of the 4p–4d doublet. To no avail we looked for this line in the FUSE spectrum of H1504+65, consistent with an upper abundance limit of solar (Ca < 6.4 × 10⁻⁵, Werner et al. 2008). The same holds for the COS spectrum where the line is not detectable as well. We had tentatively detected the 4s–4p lines at 1461.2 and 1503.6 Å in the hot PG 1159 central star of NGC 246. In the COS spectrum of H1504+65 there are lines at these positions, but it is unlikely that they stem from Ca x. At solar Ca abundance, our 200 000 K model provides too weak lines. Even a match of the weaker component at 1503.6 Å would require Ca ten times solar, clearly at odds with the non-detection of the 1159.2 Å line. Consequently, we confirm the upper limit of solar.
4.8. Iron
From Fe x lines in FUSE data a solar iron abundance was derived (Werner et al. 2010). Our models do not predict detectable lines in the COS spectral range. In particular, an unidentified feature at 1619.4 Å is not a Fe viii line in the Kurucz list located at 1619.35 Å.
Estimated errors for the abundances are ±20% for C and O and a factor of 3 for the other elements (see also Werner et al. 2004a).
4.9. Unidentified lines
A number of photospheric lines remains unidentified. The strongest of them are listed in Table 4 together with possible identifications.
5. Spectral fitting for RX J0439.8−6809
For the model fits, the spectra of H1504+65 were smoothed with 0.02 Å (FWHM) Gaussians to increase the signal-to-noise ratio (S/N). It is then about 30 but deteriorates for λ> 1500 Å. In comparison to H1504+65, the UV flux of RX J0439.8−6809 is significantly lower (about a factor of 150) but the exposure time of the G130M spectrum was nine times higher, so the S/N is about four times less. To compensate for this, the spectrum was smoothed with a 0.05 Å Gaussian. The spectra of both stars look rather similar but due to the lower S/N, less details can be seen in RX J0439.8−6809.
5.1. Helium
The lack of helium lines in the optical spectrum of RX J0439.8−6809 was claimed as evidence for helium-deficiency. In fact, this conclusion is difficult to draw. It has been shown that the most direct signature would be the lack of a NLTE central emission reversal from He ii 4686 Å (Werner 1991). All other He ii lines are in absorption and are blended by C iv and O vi lines at virtually equal wavelengths because all of these ions are one-electron systems. The same holds for He ii 1640 Å. In order to derive a strict upper limit for the He abundance, a much better optical spectrum would be needed.
5.2. Carbon and oxygen; effective temperature
Lines from C iv and O vi are identified and their relative strengths are similar to those in H1504+65, so that we conclude C/O = 1. However, there is a significant difference. The O v 1371 Å line is lacking, indicating a higher temperature compared to H1504+65. A model with Teff = 220 000 K (at log g = 8) is sufficiently hot to make the line so weak that it is not detectable in the observation. On the other hand, an upper limit to Teff can be derived by the fact, that the C iv and O vi lines become weaker with increasing temperature. We have computed models with 250 000 K and 300 000 K. The hottest model is excluded because the lines are too weak. We finally adopt Teff = 250 000 ± 30 000 K.
In the models with Teff = 200 000, the C iv 1548/1551 Å resonance doublet is comparable in strength with the higher excited subordinate lines, as it is observed in H1504+65. At higher temperatures, the resonance doublet becomes even weaker than the subordinate lines and it turns into emission at Teff > 250 000 K. It explains the non-detection of this line in the HST/STIS spectrum taken by van Teeseling et al. (1999), albeit one has to stress that the S/N of that spectrum is very poor anyhow.
5.3. Nitrogen
The N v 1239/1243 Å resonance doublet is not detectable. This is in stark contrast to the detection of two N v emission lines in the optical spectrum claimed by Reinsch et al. (2002, their Fig. 1). Indeed, one of these features near 4340 Å is a Ne viii line that is usually visible in the hottest (Teff > 150 000 K) PG 1159 stars (Werner et al. 2007) and predicted by our Teff = 250 000 model for RX J0439.8−6809. For the other feature at 4945 Å, however, we cannot offer an alternative identification. From the absence of the N v UV resonance doublet we determine an upper abundance limit of N < 0.001 for all models in the range Teff = 200 000–300 000 K. We found that models with such a low abundance do not exhibit detectable optical N v emission lines.
5.4. Neon
The wide Ne viii absorption trough in H1504+65 is just barely visible in RX J0439.8−6809, immediately pointing at a lower neon abundance. This is not a temperature effect, because the Ne viii lines become stronger with increasing Teff . The neon abundance we deduce is Ne = 0.01, with an estimated uncertainty of a factor of three.
Results of spectral analyses of H1504+65 and RX J0439.8−6809.
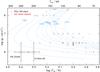 |
Fig. 3 Positions of H1504+65 and RX J0439.8−6809 in the g-Teff diagram. Also shown are the locations of PG 1159 stars (squares) and DO WDs (circles). The apparent clustering of stars at Δlog g= 0.5 steps is the consequence of employed model grids and analysis techniques that have typical errors of 0.5 dex (see, e.g., Werner & Herwig 2006). Evolutionary tracks by Althaus et al. (2009b) are labeled with the stellar mass in solar units. |
6. Stellar parameters and distances
Table 5 summarizes the results of our spectroscopic analysis together with results from previous work. The location of both stars in the g–Teff diagram is shown in Fig. 3. Also shown are evolutionary tracks for hydrogen-deficient (pre-) WDs computed by Althaus et al. (2009b) from which we derive the stellar masses. The upper limits of the error ranges required extrapolation from the two most massive tracks. We find mass ranges of 0.68–1.02 M⊙ and 0.73–1.02 M⊙ for H1504+65 and RX J0439.8−6809, respectively. The marginal difference between the mass value of H1504+65 derived here and in previous work mentioned in the Introduction (Werner et al. 2004a) arises from improved evolutionary tracks.
It should be noted that the masses could suffer from systematic errors. The used evolutionary tracks represent hydrogen-deficient, He-shell burning post-AGB stars and their hot WD descendants, whereas our stars in the present study are He-deficient. Whatever the origin of the stars, the appropriate tracks would be probably different, although it may be hoped that the differences are small at the advanced, WD evolutionary state.
Quantities used for distance determinations.
From g ~ M/R2 and  we can determine the stellar radius R and luminosity L. We find that the radius of both stars is R ≈ 0.015 ± 0.01 R⊙. They are beyond the maximum Teff of their pre-WD evolution and their luminosity has dropped from about log (L/L⊙) = 4.5 on the horizontal part of the post-AGB evolutionary track in the HRD (M = 0.869 M⊙ track of Althaus et al. 2009b) to log (L/L⊙) = 2.5 and 2.9 (H1504+65 and RX J0439.8−6809, respectively).
Distances d are computed by comparing the observed visual magnitudes with model fluxes (e.g., Heber et al. 1984):
 where Hν is the model Eddington flux at 5400 Å, M is the stellar mass in solar units, and V0 is the dereddened V magnitude, V0 = V − 3.2 × E(B − V). Reddening for RX J0439.8−6809 is computed from the relation log (NH I/E(B − V)) = 21.58 (Groenewegen & Lamers 1989), leading to E(B − V)) = 0.09, in reasonable agreement with the value 0.06 derived from dust emission maps14 (Schlegel et al. 1998). The relevant quantities for the distance determination are listed in Table 6, stellar masses and surface gravities as well as the resulting distances are given in Table 5.
The spectroscopic distance of RX J0439.8−6809 ( kpc) indicates clearly, that the star is a Galactic halo object and not located in the LMC (50 kpc, Pietrzyński et al. 2013) as suspected from its location that is roughly 1 degree off the rim of gaseous optical emission of the LMC (Greiner et al. 1994). Obviously, the direction is a chance coincidence, just like the radial velocity of the star (+220 ± 10 km s-1) being close to that of the LMC (+262 km s-1, McConnachie 2012). As mentioned in Sect. 2, the interstellar lines in the RX J0439.8−6809 COS spectrum do have a weak, high-velocity component (+150 ± 10 km s-1) which can be attributed to a Galactic high-velocity cloud. There is no component at the LMC systemic velocity.
7. Summary and conclusions
H1504+65 and RX J0439.8−6809 are the hottest known WDs and they have carbon and oxygen dominated atmospheres. Their extreme surface composition is unique and the origin of this phenomenon remains mysterious. It may be significant that their masses are considerably above the WD average (0.696 ± 0.010 M⊙ for helium-atmosphere, i.e., DB WDs, Kepler et al. 2015). Our analysis yields a maximum mass of 1.02 M⊙ for both stars, which is rather close to the minimum mass for ONeMg WDs that descended from carbon-burning super-AGB stars (1.06 M⊙, Doherty et al. 2015). Hence they could be single high-mass WDs that for an unknown reason were eroded down to their C/O envelope. Likewise, they could be usual CO WDs that underwent a late He-shell flash consuming the H-rich envelope and – again for an unknown reason (e.g., extreme mass-loss, Schönberner & Blöcker 1992; Althaus et al. 2009a) – stripped their He-envelope to expose their CO core. In both scenarios, the mass of the main sequence progenitor is relatively large, which is difficult to reconcile with the position of RX J0439.8−6809 in the halo, unless it was ejected from the disk (e.g., by the SN explosion of a binary companion). Alternatively, the masses of H1504+65 and RX J0439.8−6809 are high enough that they could be the result of the coalescence of two CO WDs (with minimum masses of ≈0.5 M⊙) whose H- and He-deficiency results from the merging process.
While H1504+65 is a relatively nearby WD (d = 0.67 kpc), RX J0439.8−6809 belongs to the Galactic halo (| z | = 5.6 kpc). Its distance is 9.2 kpc and, thus, it is not a member of the LMC as previously assumed. The lack of ISM lines with LMC systemic velocity corroborates this result. Its persistent soft X-ray luminosity as well as its optical non-variability (van Teeseling et al. 1999) are consistent with the nature as a single, hot WD that has no active nuclear burning and is on the hot end of its WD cooling track. Consequently, its cooling rate according to the 0.869 M⊙ post-AGB evolutionary track of Althaus et al. (2009b) is rather slow (dTeff/dt = 38 K yr-1) so that a 1% change in the UV/optical flux level takes 66 years, preventing a contemporary detection. This also explains the constant X-ray flux measured by ROSAT over three years instead of steadily increasing. That was regarded as a challenge to stellar-evolution theory (van Teeseling et al. 1999), however, it was based on the erroneous assumption that the star is still a very luminous, fast evolving pre-WD before entering the WD cooling sequence.
High Energy Astronomy Observatory 1.
Extreme Ultraviolet Explorer.
Hopkins Ultraviolet Telescope.
Far Ultraviolet Spectroscopic Explorer.
Hubble Space Telescope.
Space Telescope Imaging Spectrograph.
Acknowledgments
T. Rauch was supported by the German Aerospace Center (DLR) under grant 05 OR 1402. This research has made use of the SIMBAD database, operated at CDS, Strasbourg, France, and of NASA’s Astrophysics Data System Bibliographic Services. Some of the data presented in this paper were obtained from the Mikulski Archive for Space Telescopes (MAST).
References
- Althaus, L. G., Córsico, A. H., Torres, S., & García-Berro, E. 2009a, A&A, 494, 1021 [NASA ADS] [CrossRef] [EDP Sciences] [Google Scholar]
- Althaus, L. G., Panei, J. A., Miller Bertolami, M. M., et al. 2009b, ApJ, 704, 1605 [NASA ADS] [CrossRef] [Google Scholar]
- Anderson, L. S. 1989, ApJ, 339, 558 [NASA ADS] [CrossRef] [Google Scholar]
- Bashkin, S., & Stoner, J. O. 1975, Atomic energy levels and Grotrian Diagrams – Vol.1: Hydrogen I – Phosphorus XV; Vol. 2: Sulfur I – Titanium XXII [Google Scholar]
- Dere, K. P., Landi, E., Mason, H. E., Monsignori Fossi, B. C., & Young, P. R. 1997, A&AS, 125, 149 [NASA ADS] [CrossRef] [EDP Sciences] [Google Scholar]
- Doherty, C. L., Gil-Pons, P., Siess, L., Lattanzio, J. C., & Lau, H. H. B. 2015, MNRAS, 446, 2599 [Google Scholar]
- Dufour, P., Liebert, J., Fontaine, G., & Behara, N. 2007, Nature, 450, 522 [NASA ADS] [CrossRef] [PubMed] [Google Scholar]
- Dufour, P., Béland, S., Fontaine, G., Chayer, P., & Bergeron, P. 2011, ApJ, 733, L19 [NASA ADS] [CrossRef] [Google Scholar]
- Gänsicke, B. T., Koester, D., Girven, J., Marsh, T. R., & Steeghs, D. 2010, Science, 327, 188 [NASA ADS] [CrossRef] [PubMed] [Google Scholar]
- García-Berro, E., Ritossa, C., & Iben, Jr., I. 1997, ApJ, 485, 765 [NASA ADS] [CrossRef] [Google Scholar]
- Greiner, J., Hasinger, G., & Thomas, H.-C. 1994, A&A, 281, L61 [NASA ADS] [Google Scholar]
- Groenewegen, M. A. T., & Lamers, H. J. G. L. M. 1989, A&AS, 79, 359 [NASA ADS] [Google Scholar]
- Heber, U., Hunger, K., Jonas, G., & Kudritzki, R. P. 1984, A&A, 130, 119 [NASA ADS] [Google Scholar]
- Hummer, D. G., Berrington, K. A., Eissner, W., et al. 1993, A&A, 279, 298 [NASA ADS] [Google Scholar]
- Jahn, D., Rauch, T., Reiff, E., et al. 2007, A&A, 462, 281 [NASA ADS] [CrossRef] [EDP Sciences] [Google Scholar]
- Kepler, S. O., Pelisoli, I., Koester, D., et al. 2015, MNRAS, 446, 4078 [NASA ADS] [CrossRef] [Google Scholar]
- Koester, D., Weidemann, V., & Zeidler, E.-M. 1982, A&A, 116, 147 [NASA ADS] [Google Scholar]
- Kramida, A. E., Bastin, T., Biémont, E., Dumont, P.-D., & Garnir, H.-P. 1999, J. Opt. Soc. Am. B: Opt. Phys., 16, 1966 [NASA ADS] [CrossRef] [Google Scholar]
- Kruk, J. W., & Werner, K. 1998, ApJ, 502, 858 [NASA ADS] [CrossRef] [Google Scholar]
- Kurucz, R. L. 1991, in Stellar Atmospheres – Beyond Classical Models, eds. L. Crivellari, I. Hubeny, & D. G. Hummer, NATO ASIC Proc., 341, 441 [Google Scholar]
- Kurucz, R. L. 2009, in AIP Conf. Ser. 1171, eds. I. Hubeny, J. M. Stone, K. MacGregor, & K. Werner, 43 [Google Scholar]
- Kurucz, R. L. 2011, Canadian J. Phys., 89, 417 [NASA ADS] [CrossRef] [Google Scholar]
- Landi, E., Young, P. R., Dere, K. P., Del Zanna, G., & Mason, H. E. 2013, ApJ, 763, 86 [NASA ADS] [CrossRef] [Google Scholar]
- McConnachie, A. W. 2012, AJ, 144, 4 [NASA ADS] [CrossRef] [Google Scholar]
- Nousek, J. A., Shipman, H. L., Holberg, J. B., et al. 1986, ApJ, 309, 230 [NASA ADS] [CrossRef] [Google Scholar]
- Nugent, J. J., Jensen, K. A., Nousek, J. A., et al. 1983, ApJS, 51, 1 [NASA ADS] [CrossRef] [Google Scholar]
- Pietrzyński, G., Graczyk, D., Gieren, W., et al. 2013, Nature, 495, 76 [NASA ADS] [CrossRef] [PubMed] [Google Scholar]
- Rauch, T., & Deetjen, J. L. 2003, in Stellar Atmosphere Modeling, eds. I. Hubeny, D. Mihalas, & K. Werner, ASP Conf. Ser., 288, 103 [Google Scholar]
- Reindl, N., Rauch, T., Werner, K., Kruk, J. W., & Todt, H. 2014, A&A, 566, A116 [NASA ADS] [CrossRef] [EDP Sciences] [Google Scholar]
- Reinsch, K., Beuermann, K., & Gänsicke, B. T. 2002, in The Physics of Cataclysmic Variables and Related Objects, eds. B. T. Gänsicke, K. Beuermann, & K. Reinsch, ASP Conf. Ser., 261, 653 [Google Scholar]
- Richter, P., de Boer, K. S., Widmann, H., et al. 1999, Nature, 402, 386 [NASA ADS] [CrossRef] [PubMed] [Google Scholar]
- Schlegel, D. J., Finkbeiner, D. P., & Davis, M. 1998, ApJ, 500, 525 [NASA ADS] [CrossRef] [Google Scholar]
- Schönberner, D., & Blöcker, T. 1992, in The Atmospheres of Early-Type Stars, eds. U. Heber & C. S. Jeffery (Berlin: Springer Verlag), Lect. Notes Phys., 401, 305 [Google Scholar]
- Seaton, M. J., Yan, Y., Mihalas, D., & Pradhan, A. K. 1994, MNRAS, 266, 805 [NASA ADS] [CrossRef] [Google Scholar]
- Smoker, J. V., Fox, A. J., & Keenan, F. P. 2015, MNRAS, 451, 4346 [NASA ADS] [CrossRef] [Google Scholar]
- van Teeseling, A., Reinsch, K., & Beuermann, K. 1996, A&A, 307, L49 [NASA ADS] [Google Scholar]
- van Teeseling, A., Gänsicke, B. T., Beuermann, K., et al. 1999, A&A, 351, L27 [NASA ADS] [Google Scholar]
- Werner, K. 1991, A&A, 251, 147 [NASA ADS] [Google Scholar]
- Werner, K., & Dreizler, S. 1999, J. Comput. Appl. Math., 109, 65 [NASA ADS] [CrossRef] [Google Scholar]
- Werner, K., & Herwig, F. 2006, PASP, 118, 183 [NASA ADS] [CrossRef] [Google Scholar]
- Werner, K., & Wolff, B. 1999, A&A, 347, L9 [Google Scholar]
- Werner, K., Deetjen, J. L., Dreizler, S., et al. 2003, in Stellar Atmosphere Modeling, ed. I. Hubeny, D. Mihalas, & K. Werner, ASP Conf. Ser., 288, 31 [Google Scholar]
- Werner, K., Rauch, T., Barstow, M. A., & Kruk, J. W. 2004a, A&A, 421, 1169 [NASA ADS] [CrossRef] [EDP Sciences] [Google Scholar]
- Werner, K., Rauch, T., Reiff, E., Kruk, J. W., & Napiwotzki, R. 2004b, A&A, 427, 685 [NASA ADS] [CrossRef] [EDP Sciences] [Google Scholar]
- Werner, K., Rauch, T., & Kruk, J. W. 2007, A&A, 474, 591 [NASA ADS] [CrossRef] [EDP Sciences] [Google Scholar]
- Werner, K., Rauch, T., & Kruk, J. W. 2008, A&A, 492, L43 [NASA ADS] [CrossRef] [EDP Sciences] [Google Scholar]
- Werner, K., Rauch, T., & Kruk, J. W. 2010, ApJ, 719, L32 [NASA ADS] [CrossRef] [Google Scholar]
- Werner, K., Dreizler, S., & Rauch, T. 2012, TMAP: Tübingen NLTE Model-Atmosphere Package, Astrophysics Source Code Library [Google Scholar]
- Werner, K., Rauch, T., & Kepler, S. O. 2014, A&A, 564, A53 [NASA ADS] [CrossRef] [EDP Sciences] [Google Scholar]
- Woosley, S. E., & Heger, A. 2015, ApJ, 810, 34 [NASA ADS] [CrossRef] [Google Scholar]
All Tables
Number of levels and lines of model ions used for line formation calculations of metals.
All Figures
|
Fig. 1 HST/COS spectrum of H1504+65 and a model (Teff = 200 000 K, log g= 8, C = 0.46, O = 0.46, Ne = 0.06, Mg = 0.02). Observation and model were folded with 0.02 Å and 0.1 Å Gaussians, respectively. Unidentified photospheric lines are marked with “?”. Other observed narrow lines are of interstellar origin (the strongest are marked with circles). “λ?” denotes lines in the model with uncertain wavelength position. |
| In the text | |
|
Fig. 2 HST/COS spectrum of RX J0439.8−6809 and a model (Teff = 250 000 K, log g= 8, C = 0.495, O = 0.495, Ne = 0.01). Observation and model were folded with 0.05 Å and 0.1 Å Gaussians, respectively. Unidentified photospheric lines are marked with “?”. Other observed narrow lines are of interstellar origin (the strongest are marked with circles). |
| In the text | |
|
Fig. 3 Positions of H1504+65 and RX J0439.8−6809 in the g-Teff diagram. Also shown are the locations of PG 1159 stars (squares) and DO WDs (circles). The apparent clustering of stars at Δlog g= 0.5 steps is the consequence of employed model grids and analysis techniques that have typical errors of 0.5 dex (see, e.g., Werner & Herwig 2006). Evolutionary tracks by Althaus et al. (2009b) are labeled with the stellar mass in solar units. |
| In the text | |
Current usage metrics show cumulative count of Article Views (full-text article views including HTML views, PDF and ePub downloads, according to the available data) and Abstracts Views on Vision4Press platform.
Data correspond to usage on the plateform after 2015. The current usage metrics is available 48-96 hours after online publication and is updated daily on week days.
Initial download of the metrics may take a while.