Fig. 3
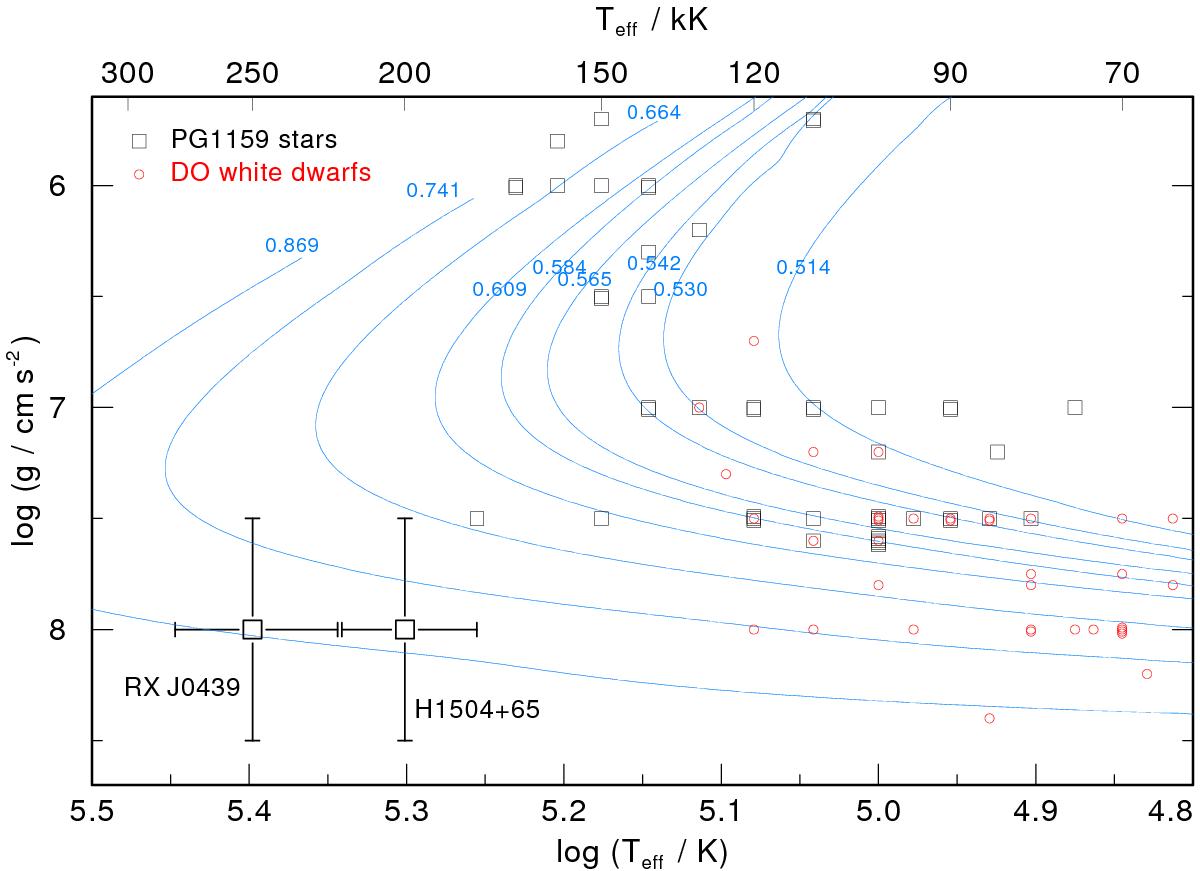
Positions of H1504+65 and RX J0439.8−6809 in the g-Teff diagram. Also shown are the locations of PG 1159 stars (squares) and DO WDs (circles). The apparent clustering of stars at Δlog g= 0.5 steps is the consequence of employed model grids and analysis techniques that have typical errors of 0.5 dex (see, e.g., Werner & Herwig 2006). Evolutionary tracks by Althaus et al. (2009b) are labeled with the stellar mass in solar units.
Current usage metrics show cumulative count of Article Views (full-text article views including HTML views, PDF and ePub downloads, according to the available data) and Abstracts Views on Vision4Press platform.
Data correspond to usage on the plateform after 2015. The current usage metrics is available 48-96 hours after online publication and is updated daily on week days.
Initial download of the metrics may take a while.