| Issue |
A&A
Volume 584, December 2015
|
|
|---|---|---|
| Article Number | A82 | |
| Number of page(s) | 19 | |
| Section | Extragalactic astronomy | |
| DOI | https://doi.org/10.1051/0004-6361/201526790 | |
| Published online | 24 November 2015 | |
A variable-density absorption event in NGC 3227 mapped with Suzaku and Swift
1
Dr. Remeis-Sternwarte & Erlangen Centre for Astroparticle
Physics, Universität Erlangen-Nürnberg,
Sternwartstrasse 7,
96049
Bamberg,
Germany
e-mail:
tobias.beuchert@sternwarte.uni-erlangen.de
2
Lehrstuhl für Astronomie, Universität Würzburg,
Emil-Fischer-Straße
31, 97074
Würzburg,
Germany
3
Center for Astrophysics and Space Sciences, University of
California, San Diego, 9500 Gilman
Dr., La Jolla,
CA
92093-0424,
USA
4
Centro de Astrobiología (CSIC–INTA), Dep. de Astrofísica, European
Space Astronomy Centre, PO Box 78, Villanueva de la Cañada,
28691
Madrid,
Spain
5 Instituto de Astronomía, Universidad Nacional Autónoma de
México (UNAM), 04510 Ciudad de México, D.F. México
6
European Space Agency, European Space Astronomy Centre, PO Box 78,
Villanueva de la Cañada, 28691
Madrid,
Spain
7
Physics and Astronomy Department, UCLA, Los
Angeles, CA
90095-1562,
USA
8
Harvard-Smithsonian Center for Astrophysics, 60 Garden St.,
Cambridge,
MA
02138,
USA
9 Instituto de Astronomía, Universidad Nacional Autónoma de
México, Km 103, Carret, Tijuana-Ensenada, 22860 Ensenada, BC, Mexico ( PO Box 439027, San
Ysidro, CA, 92143, USA )
10
Instituto de Astrofísica de Andalucía (CSIC),
Apartado 3004,
18080
Granada,
Spain
Received: 19 June 2015
Accepted: 10 August 2015
Context. The morphology of the circumnuclear gas accreting onto supermassive black holes in Seyfert galaxies remains a topic of much debate. As the innermost regions of active galactic nuclei (AGN) are spatially unresolved, X-ray spectroscopy, and in particular line-of-sight absorption variability, is a key diagnostic to map out the distribution of gas.
Aims. Observations of variable X-ray absorption in multiple Seyferts and over a wide range of timescales indicate the presence of clumps/clouds of gas within the circumnuclear material. Eclipse events by clumps transiting the line of sight allow us to explore the properties of the clumps over a wide range of radial distances from the optical/UV broad line region (BLR) to beyond the dust sublimation radius. Time-resolved absorption events have been extremely rare so far, but suggest a range of density profiles across Seyferts. We resolve a weeks-long absorption event in the Seyfert NGC 3227.
Methods. We examine six Suzaku and 12 Swift observations from a 2008 campaign spanning five weeks. We use a model accounting for the complex spectral interplay of three absorbers with different levels of ionization. We perform time-resolved spectroscopy to discern the absorption variability behavior. We also examine the IR to X-ray spectral energy distribution (SED) to test for reddening by dust.
Results. The 2008 absorption event is due to moderately-ionized (log ξ ~ 1.2–1.4) gas covering 90% of the line of sight. We resolve the density profile to be highly irregular, in contrast to a previous symmetric and centrally-peaked event mapped with RXTE in the same object. The UV data do not show significant reddening, suggesting that the cloud is dust-free.
Conclusions. The 2008 campaign has revealed a transit by a filamentary, moderately-ionized cloud of variable density that is likely located in the BLR, and possibly part of a disk wind.
Key words: galaxies: active / galaxies: Seyfert / galaxies: nuclei
© ESO, 2015
1. Introduction
X-ray spectroscopy allows us to probe circumnuclear matter obscuring the direct line of sight to the supermassive black holes (SMBHs) that power active galactic nuclei (AGN). This material can be part of a dusty torus surrounding the nucleus (Antonucci 1993), of the broad line region (BLR), or a disk outflow. Variable absorption has been found for a number of AGN, e.g., a sample of 12 Seyfert 1.5 galaxies with inclination angles comparable to the torus opening angle. These include NGC 3227 (Beuchert et al. 2013), as well as other AGN with intermediate optical classifications, such as NGC 4051 (Guainazzi et al. 1998), MCG−6-30-15 (McKernan & Yaqoob 1998), or NGC 3516 (Turner et al. 2008). Risaliti et al. (2002) studied an X-ray selected set of 25 Seyfert 2 galaxies and found soft X-ray variability on both long and short timescales. Short-term (~1 d) absorption events have been detected, e.g., for Mrk 766 (Risaliti et al. 2011), NGC 5506 (Markowitz et al. 2014), NGC 4388 (Elvis et al. 2004), and NGC 1365 (Risaliti et al. 2007, 2009a,b). Long-term events (≥7 d) have been found for, e.g., Cen A (Rivers et al. 2011a), Fairall 9 (Lohfink et al. 2012), or NGC 3227 in 2000/2001 (Lamer et al. 2003), thanks to Rossi X-ray Timing Explorer (RXTE) monitoring.
These absorption events can be explained by transits of discrete clouds or clumps of gas across the line of sight to the central X-ray continuum source (e.g., Risaliti et al. 2002; Lohfink et al. 2012; Markowitz et al. 2014). They support a new generation of “clumpy torus” models (Elitzur 2007; Nenkova et al. 2002, 2008a,b). In these models, clouds are typically concentrated toward the equatorial plane but with a soft-edge angular distribution, usually on near-Keplerian orbits, and possibly embedded in a tenuous intercloud medium (Stalevski et al. 2012). Outside the dust sublimation radius, which is typically several light weeks away from the SMBH, the presence of this clumpy component is supported by fits to the infrared spectral shape (Asensio Ramos & Ramos Almeida 2009; Alonso-Herrero et al. 2011). Closer to the SMBH, the population of dusty clouds may transition to the dust-free clouds that comprise the BLR (Elitzur 2007). A clumpy X-ray absorbing medium located at distances commensurate with the BLR, and possibly identified as BLR clouds themselves, has also been suggested (Risaliti et al. 2009a, 2011). Arav et al.’s 1998 investigation of optical line profiles in NGC 4151 also supports this kind of distribution of discrete BLR clouds, with a large number of rather small clouds. From an observational point of view, however, the mid-infrared (MIR) emission only probes matter outside the dust sublimation zone, while X-ray absorption probes the full radial range. Many of the short-term X-ray absorption events have been interpreted as BLR clouds (Risaliti et al. 2007), while the longer term events found, e.g., by Markowitz et al. (2014, with durations of more than a few days to more than a year,) were inferred to be due to clouds residing in the outer BLR or the inner dusty torus.
When adequate data are available, i.e., sustained sampling on timescales longer than the eclipse duration that resolves the eclipses, one is able to pinpoint their ingress and egress and to obtain time-resolved information on the column density profile NH(t) along the transverse direction. Only a few density profiles have been resolved. The events in NGC 3227 and Cen A mentioned above featured symmetric, nonuniform, and centrally-peaked column density profiles. An event in Mkn 348 may also fall into this category (Akylas et al. 2002). Maiolino et al. (2010) report comet-shaped clouds, with dense “heads” and less-dense “tails”, in NGC 1365. Markowitz et al. (2014) report a double-peaked absorption event in NGC 3783. These results indicate a broad variety of profile shapes, hinting at a range in the cloud origins and/or the physical mechanisms that shape clouds.
To add complexity to the interpretation of X-ray spectra, a significant number of Seyferts also show evidence of a complex interplay of differently ionized layers of warm absorbing gas along the line of sight (e.g., Blustin et al. 2005; Turner et al. 2008). This gas likely originates in the accretion disk, the BLR, or the inner torus (George et al. 1998; Krolik & Kriss 2001; Reynolds & Fabian 1995). Blue-shifted absorption features indicate that some warm absorbers are outflowing along the line of sight (Blustin et al. 2005) and may be launched from the inner accretion disk (Krongold et al. 2007). The observed warm absorbers could be part of stratified outflows (Tombesi et al. 2013). These disk winds can be launched by magneto-hydrodynamical (MHD) forces (Blandford & Payne 1982; Contopoulos & Lovelace 1994; Fukumura et al. 2010).
The Seyfert 1.5 AGN NGC 3227 was subjected to sustained monitoring with RXTE from 1999-Jan-02 to 2005-Dec-04 (Uttley & McHardy 2005). The monitoring revealed two eclipse events: an ~80-day event in 2000/2001 (Lamer et al. 2003) and a 2–7 day event in 2002 (Markowitz et al. 2014). The estimated distances from the central engine are tens of light days (ld). Given the estimated location of the BLR from the SMBH, at 2–19 ld (Peterson et al. 2004; Landt et al. 2008), and the inner edge of the IR-emitting torus as determined by reverberation mapping, ~20 ld (Suganuma et al. 2006), these clouds are likely in the inner dusty torus or at least the outermost BLR.
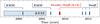 |
Fig. 1 Timeline including all observations of NGC 3227 discussed here. The blue region shows the time range of sustained RXTE monitoring from 1999-Jan-02 to 2005-Dec-04 (Uttley & McHardy 2005). The observations by Suzaku and Swift from the 2008 campaign are marked in red; the times of the XMM-Newton and recent Swift observations are shown in blue. |
In this paper, we present an additional, intriguing, absorption event in NGC 3227 found in quasi-simultaneous Suzaku and Swift data from 2008. The column density profile turns out to be highly irregular. In Sect. 2 we present the data reduction, while Sect. 3 revisits the two already published XMM-Newton observations to define a model that we use to simultaneously fit the archival Suzaku observations. The X-ray and UV data provided by Swift are also analyzed. In Sect. 5 we discuss the properties and location of the absorbing cloud and its possible origin in light of these observations.
Suzaku and Swift observations in 2008 with their screened exposure times.
2. Observations and data reduction
2.1. Observations
Figure 1 provides an overview of all of the archival observations of NGC 3227 that we consider. NGC 3227 was the subject of a 35 d long Suzaku and Swift monitoring campaign between 2008 October 2 and 2008 December 03. The campaign consists of six Suzaku and 12 nearly simultaneous Swift observations (Table 1). Outside of this campaign, further archival data with good soft X-ray coverage are provided by two XMM-Newton observations, one from 2000 November 28–29 at the onset of the 2000/2001 absorption event (obsid: 0101040301, exposure time post screening 32 ks; Lamer et al. 2003), and a 97 ks observation on 2006 December 3–4 (obsid: 0400270101; Markowitz et al. 2009) during a state with intrinsically high flux and relatively low absorption. The observation from 2006 yielded reflection grating spectrometer (RGS) data of sufficient signal to noise for a detailed analysis of the absorbers. Recent Swift pointings, from 2013 October 20 until 2015 May 02, are also included in our analysis.
For the reduction of these data, we used heasoft v. 6.15.1 and XMM-Newtonsas v. 13.5.0. The spectral analysis is performed with the Interactive Spectral Interpretation System (ISIS; Houck & Denicola 2000). Uncertainties in spectral fit parameters correspond to the 90% confidence level for one interesting parameter. We use the systemic redshift of z = 0.00386 (de Vaucouleurs et al. 1991) and a Galactic equivalent hydrogen column of NH = 1.99 × 1020 cm-2 (Kalberla et al. 2005). The black hole mass is assumed to be 1.75 × 10⁷M☉, the average of various measurements collected at the AGN Black Hole Mass Database1. Luminosities are calculated using a luminosity distance of 20.3 Mpc (Mould et al. 2000). We perform the K-correction according to Ghisellini et al. (2009). Neutral absorption is modeled with tbnew, an improved version of the absorption model of Wilms et al. (2000), using cross sections from Verner et al. (1996) and abundances from Wilms et al. (2000). Ionized absorption is modeled using the zxipcf model, which is based on XSTAR tables (Kallman & Bautista 2001). In this model, following Tarter et al. (1969), the ionization parameter, ξ, for a medium at distance R from a source of luminosity Lion is defined as  (1)where nH is the hydrogen number density of the absorber.
2.2. XMM-Newton
Both XMM-Newton observations were taken in full-frame mode of the EPIC-pn camera (Strüder et al. 2001; Turner et al. 2001). After creating calibrated event lists with filtered hot and bad pixels, events in 10–12 keV are screened for enhanced rates due to particle flaring. As no pileup is evident, we extract 0.3–10 keV spectra from all counts within 40′′ of the central source position of NGC 3227. The same angular radius of the extraction region is used to extract the background from a position ~6′ off-source on the same CCD-chip.
2.3. Suzaku
We extract both the data of the X-ray Imaging Spectrometer (XIS; Koyama et al. 2007) and the Hard X-ray Detector (HXD; Takahashi et al. 2007). We use data taken by the front (XIS 0,3) and back-illuminated (XIS1) chips in the 3 × 3 and 5 × 5 editing modes. We reprocess the unfiltered event lists by applying the newest calibration available and screened the data with default parameters. We then perform an attitude correction with aeattcor2 based on the 3 × 3 mode, which comprises the bulk of data. The resulting spectra of the 3 × 3 and 5 × 5 modes are merged using mathpha for each XIS. Spectra are extracted from circular regions of ~93′′ radius and centered on the point source. We normalize all fluxes with respect to XIS0. Our fits find that the flux normalization of the XIS1 and XIS3 spectra deviates by about 5% from that of the XIS0 spectrum, consistent with the Suzaku ABC guide2, version 5.0. We perform simultaneous fits of observations Suz 2–Suz 6 using the SimFit routines of ISIS (Kühnel et al. 2015), and rebin their spectra to a combined minimum signal-to-noise ratio (S/N) of 25. Observation Suz 1 is fitted separately and binned to a minimum S/N of 18. In both cases, the binning does not exceed the energy resolution of the XIS detectors of 150 eV at ~6 keV in 20083. As a result of calibration uncertainties caused by the Si- and Au-edges, we exclude data in the 1.72–1.88 keV and 2.19–2.37 keV energy bands. For Suz 1 the first interval is extended to 1.5–1.88 keV because of further insufficient calibration just above 1.5 keV.
The nonimaging HXD-PIN data are extracted for the whole field of view of 34′ × 34′. For a list of total counts and good exposure times, see Table 1. The flux normalization of the HXD with respect to XIS0 has a large uncertainty because of the low S/N of the HXD data, but is consistent with what is expected for the current calibration. We therefore fix the HXD flux normalization constant to its nominal value of 1.16.
2.4. Swift
The X-ray Telescope (XRT) on board Swift (Burrows et al. 2005) provides imaging and spectroscopic capabilities for the energy range 0.5–10 keV. Except for observations Sw 2a,b and Sw 3a, which were taken in windowed-timing (WT) mode, all observations were performed in photon-counting (PC) mode. For the PC mode we allow grades from 0 to 12. We only extract grade 0 events for the WT mode. We extract source counts within 30′ of the source position. The background is extracted from circular regions of at least 60′′ radius on a position on the chip, which is free of background sources. We exclude observation Sw 1b from our analysis because of an excess above 7 keV of unknown origin. Observation Sw 6a was also ignored because of an insufficient number of detected counts.
The Ultraviolet and Optical Telescope (UVOT) on board Swift observes with up to six filters (Roming et al. 2005, UVW2, UVM2, UVW1, U, B, and V). The UVOT image data have been summed using uvotimsum (V. 24Jan2014_V6.15.1). A circular region of 5′′ around the source position was used for the extraction of counts of the central core component. The background was defined as an annulus around the source with 13′′ and 26′′ inner and outer radius to minimize contributions from the host galaxy. The resulting files were converted into pha files using the uvot2pha task and dereddened as discussed in Sect. 3.4.
3. X-ray spectral analysis
The main focus of the data analysis lies on the simultaneous Suzaku and Swift data describing an additional absorption event. In the following, we first build up a spectral baseline model using the Suzaku data. With help of this model, we revisit the two archival XMM-Newton observations and finally model each set of Suzaku and Swift observations simultaneously.
3.1. A baseline model based on Suzaku data
Before we start to develop a baseline spectral model for NGC 3227, we briefly review the previous attempts to describe the spectrum. Lamer et al. (2003) describe the 2000 XMM-Newton observation with a power law absorbed by material with neutral or low ionization (hereafter WA1) and an unabsorbed power law. The slope of the absorbed power law was difficult to constrain. As shown by Lamer et al. (2003), this model is highly degenerate in ξ (two orders of magnitude) and NH. We find that a lower degree of degeneracy can be obtained by assuming a partial covering scenario, which yields comparable statistics. The lack of sufficient RGS data and the relatively low S/N did not allow Lamer et al. (2003) to constrain more absorbers.
In contrast, the 2006 XMM-Newton observation caught the source in a typical hard X-ray flux and spectral state, i.e., unabsorbed by moderately Compton-thick gas. The high soft X-ray flux and the long exposure time allowed Markowitz et al. (2009) to obtain a high S/N RGS spectrum. They constrained two layers of ionized absorption, one absorber that is moderately ionized, log ξ ~ 1.45, and one absorber that is highly ionized, log ξ ~ 2.93. We call these WA2 and WA3 in the following. Markowitz et al. (2009) also detected an absorber with a small neutral column, which is similar to WA1 seen in 2000 by Lamer et al. (2003).
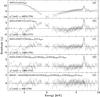 |
Fig. 2 Example of the steps followed to find the best-fit baseline model on the Suzaku spectra (we use observation Suz 3 in this example). a) Fit to the spectrum with a single power law absorbed by neutral gas. b) The neutral absorber is partially covering the incident power law. c) As a result of characteristic residuals, we replace the solely neutral absorber by an ionized absorber; and d) two more warm absorbers leading to a stratified composite of differently ionized absorbers. e) The remaining residuals in the soft band and around 6.4 keV are flattened when finally adding a reflected power law in panel. |
In deriving the baseline model for our analysis, we use the high S/N Suzaku data and assume from now on that WA1, WA2, and WA3, which we assume to represent physically distinct absorbing media with different levels of ionization, are present in all XMM-Newton, Suzaku, and Swift observations. The assumption that WA1, WA2, and WA3 are present in all observations and stable over durations of many years is a simplifying one; in some cases, a given absorber may not be statistically required in the fits, particularly, if the column densities of the other absorbers are such that they dominate the spectral shape. In addition, as demonstrated below, we observe a wide range of column densities in WA1 and WA2 across spectra taken several years apart. A simple assumption is that each absorber remains present in all observations, and has varied primarily in column density and not ionization state. However, we cannot exclude the possibility of some observations capturing an additional physically distinct absorber with similar ionization level moving into the line of sight.
Figure 2 shows the steps followed to find the best-fit baseline model on the 2008 Suzaku spectra motivated by Lamer et al. (2003) and Markowitz et al. (2009). We use observation Suz 3 in this example, which has the best combination of count rate and strong absorbing column density. The χ2 of each fit is labeled in the figure and shows the gradual improvement of the model. In Fig. 2a the high-energy X-ray power law (HXPL) absorbed by one layer of neutral absorption (CA). Apart from the prominent Fe Kα line around 6.4 keV, the strong residuals below 4 keV suggest a partial covering scenario similar to that seen in the 2000 XMM-Newton data. Assuming partial absorption by a neutral medium results in the residuals shown in Fig. 2b. The residuals still show strong positive and negative excesses below 3 keV. Replacing the neutral absorber by a warm absorbing layer of very low ionization results in substantially flattened residuals (Fig. 2c). We identify this component with WA1.
While this model is able to describe the smooth turnover of the partial coverer, some residuals remain. Based on the 2006 XMM-Newton observation, we model these residuals by including two additional layers of ionized absorption, WA2 and WA3 (Fig. 2d). Here, following the RGS analysis of Markowitz et al. (2009), the absolute redshift of WA3 is fixed at −0.00302. The fit requires the moderately-ionized absorber WA2 (log ξ ~ 0.5) to be dominant and partially covering.
Leftover residuals in the final continuum fit are line-like features in the soft band around 0.9 keV, which are most likely due to Ne ix emission and the strong signature of a Fe Kα/Fe Kβ complex between 6.4 and 7.1 keV. These soft and hard components can either be modeled individually using empirical emission lines, or by adding ionized reflection (modeled with xillver; García et al. 2013), where we require that the reflected continuum has the same shape as the primary continuum. Both approaches describe all of the excess components equally well and without appreciably changing the continuum parameters. Because of the unique physical interpretation and the smaller number of free parameters, we continue the modeling with xillver. The resulting model describes the data very well (Fig. 2e).
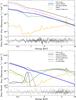 |
Fig. 3 The 2006 (top) and 2000 (bottom) XMM-Newton spectra, the best-fit model components, and the complete model shown with thick and thin solid lines, respectively. Both spectra are described by the baseline model that comprises a high-energy X-ray power law with a reflection component and absorption by three layers of low-, moderate- and high-ionization gas as well as a Galactic column. The source is partially covered by WA2 for the 2006 and by WA1 for the 2000 observation. The data from 2006 also require a steep soft excess. The sharp residuals at ~1.85 keV are likely due to calibration uncertainties around the Si K edge. |
Continuum parameters of the spectral fit of the baseline model to the relatively unabsorbed 2006 XMM-Newton observation.
Continuum parameters of the spectral fit of the derived baseline model to the absorbed 2000 XMM-Newton observation.
3.2. Revisiting the XMM-Newton spectra with the baseline model
We now test whether the baseline model also describes the XMM-Newton observations that have been used to motivate this model and its absorbers. The spectra and model components of the 2000 and 2006 XMM-Newton observations are shown in Fig. 3. The continuum is described by an absorbed high-energy power law, leaked emission, and unblurred ionized reflection components. Table 2 and Table 3 list the best-fit parameters.
Because of the inability to constrain the covering fraction of the absorbers with low (WA1) and high (WA3) ionization, we always require them to fully cover the compact source, while their column densities and ionization parameters are all left free to vary.
The continuum as well as the Fe K α/β lines of the 2006 XMM-Newton observation are well fitted with a combination of an incident power law and ionized reflection component (García et al. 2013, xillver). The two modest absorption dips, at around 0.75 keV and 0.9 keV, require WA2 to have log ξ ~ 2 and to cover the X-ray source by ~50%. Figure 4 shows the 0.5–2.3 keV unfolded spectra of both the Suz 1 observation from 2008 and the XMM-Newton observation from 2006. The two absorption features enclosed by the gray shaded region are found at about the same energy in both spectra, arguing for WA2 as a common origin. The similar spectral shape prefers WA2 to be partial covering in both observations. In contrast to the 2000 data, a steep soft excess is seen in 2006, which we describe by a soft power law (SXPL), consistent with the results of Markowitz et al. (2009). The fit converges to a statistic of χ2/ d.o.f. = 1851 / 1542.
While the data from 2006 are described well with the partially covering absorber WA2, the 2000 data require a dominant partial covering column of low-ionization gas (WA1). Given the strong X-ray absorption, it is not clear if a soft excess is present in the spectrum. If our partial-covering model is correct and the continuum below ~2 keV is dominated by leaked emission, then the soft excess (Γ ~ 3) must have had a negligible presence. Given the low S/N of the data, with the exception of the column of WA2 the parameters of the two highest ionized absorbers, WA2 and WA3, cannot be constrained and are assumed to be equal to those found in the 2006 data. The emission feature at ~0.88 keV is described by a narrow unresolved Gaussian for Fe L xvii at 0.826 keV and an O viii radiative recombination continuum (RCC) at 0.871 keV. We find the best-fit statistic to be χ2/ d.o.f. = 901 / 847, which is consistent with that found by Lamer et al. (2003).
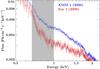 |
Fig. 4 Comparison of the 2006 XMM-Newton and Suz 1 observations in the 0.5–2.3 keV range. The gray area marks the energy range comprising two modest absorption features that are due to an absorber of similar ξ, i.e., WA2. |
List of parameters for the simultaneous fit of observations Suz 2 to Suz 6 and the individual fit of the observation Suz 1.
We conclude that the XMM-Newton data of both the absorbed (2000) and relatively unabsorbed (2006) observations of NGC 3227 can be described with our baseline model regarding the absorber structure and unblurred reflection. The spectral variability between both is dominated by the absorption component WA1 with low ionization.
3.3. Simultaneous fit to all Suzaku spectra
The success of the baseline model in describing both the individual Suzaku data and the XMM-Newton data suggests that we can use it to model all 2008 Suzaku spectra simultaneously. The fit results indicate that the parameters of WA1 and WA3 stay constant during the 2008 observational campaign, while the spectral variability is dominated by WA2. We have to model Suz 1 separately, as it does not share some of the time-independent parameters. Table 4 lists the results of the fit.
In more detail, the time-independent parameters include the detector constants, the iron abundance ZFe of the ionized reflector (a simultaneous fit of Suz 2 to 6 yields ZFe = 2.81 ± 0.17) and all parameters of the nonvarying ionized absorbers WA1 and WA3. The absorbers WA1 and WA3 with low- and high-ionization are assumed to fully cover the central source. The absorber WA1 has a relatively low column density of 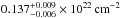 of low-ionization (
 ) gas for Suz 1 and
 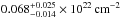 (log ξ = −0.9 ± 0.6) for the later five observations. While both log ξ are consistent with each other, the column found in Suz 1 is slightly higher. For WA3 the column densities are consistently around ~4 × 1022 cm-2, while the ionization parameter differs between the single fit of Suz 1 (
 ) and the other observations, which have (
 ). Figure 5 shows how both instances of WA3 affect the high-energy power law. The model with log ξ ~ 3.4 for Suz 1 imprints a clear absorption feature around 0.9–1.0 keV due to Ne ix and Ne x. A column of comparable ionization was also constrained by Markowitz et al. (2009) but disappears in Suz 2 to Suz 6. It may, however, still be intrinsically present but undetected because of degeneracies within the model description. The highly-ionized absorber WA3 (log ξ ~ 4) shows weak absorption lines from the highly-ionized species of ion (Fig. 5). These are difficult to constrain in a single Suzaku observation but are consistent with the detailed study of Suz 1–Suz 3 by Gofford et al. (2013), who show the existence of absorption lines due to He-like and H-like Fe.
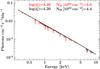 |
Fig. 5 Effect of WA3 if it were to fully cover the background power law. The warm absorber of observation Suz 1 is shown in red; black shows the effect of the absorber found in the remaining Suzaku observations. |
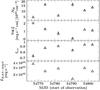 |
Fig. 6 Temporal evolution of the parameters describing the variable moderately ionized absorber WA2 and the luminosity in the 0.6–10 keV X-ray band for the six Suzaku observations. |
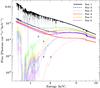 |
Fig. 7 Effect of the partial coverer WA2 onto a power law (thick lines with line styles given in the figure) as part of the best-fit model (Fig. 8). The thin and solid lines of lighter color show the effect the coverer would have if it were to fully cover the source. |
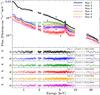 |
Fig. 8 Spectra and residuals in units of standard deviations for a fit of the baseline model to the Suzaku spectra of the 2008 campaign (Table 4). A single fit is performed for the high state observation (Suz 1), while the remaining observations (Suz 2–Suz 6) are fitted as part of one simultaneous fit with tied time-independent parameters. The statistics printed in the residual panels correspond to the best-fit on each observation, using the appropriate time-dependent parameters. |
List of parameters for the simultaneous fit of all Swift observations.
The time-dependent group parameters of the model represent the effects of variability. In particular we mention the variability of the moderately ionized and partially covering absorber WA2. Simultaneous fitting isolates WA2 as the only variable layer of absorption within the complex interaction of the three absorbers contained in the model. Figure 6 shows the time evolution of the fit parameters NH, log ξ, fcvr and the X-ray luminosity LX. The covering fraction scatters around ~0.9. Only Suz 1 shows a lower value of ~0.74. The column density peaks in a complex fashion between 5–18× 1022 cm22 across all six observations. The ionization parameter first decreases from log ξ ~ 2 to nearly zero and then increases again to values of log ξ ~ 1 for the last two observations. In Fig. 7 we illustrate the effect of WA2 onto the power-law continuum if this absorber had a covering fraction of unity (see also Fig. 8). This representation of the model helps to identify the most prominent contributing absorption features below 1 keV, which are mainly due to the He-like and H-like ions O vii, O viii, Ne ix, and Ne x4.
Other variable parameters are the photon-index Γ that scatters between ~1.6 and ~1.7. We also find moderate ionization states of the reflecting and absorbing material ranging from log ξ ~ 0.8 up to ~2.
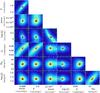 |
Fig. 9 Color-coded Δχ2 contours for relevant spectral parameters of Suz 2. The 68.27%, 90%, and 99% contours correspond to the solid, dashed, and dotted lines. The color code ranges from brown (small Δχ2) up to dark blue (large Δχ2). |
The results of the fits are shown in Fig. 8. We show the XIS and HXD spectra of all observations including the best-fit models. The residual panels suggest a fit that describes the continuum well with adequate statistics. Figure 17 gives an overview of all Suzaku spectra shown together with the full model and the best-fit model components. An emission excess above the power law in the energy range covered by Suzaku/HXD/PIN is clearly visible, most likely due to the Compton hump peaking around 30 keV. The 6.4 keV Fe Kα line is self-consistently modeled by reflection off Compton-thick gas (xillver), as is the extra emission below 1 keV. Figure 17 illustrates that the reflection parameters are mainly derived from that soft emission and the iron line complex as dominant features. The HXD/PIN data quality is good enough to constrain the normalization of xillver. No extra soft emission component is needed in contrast to the 2006 XMM-Newton observation. Although we cannot rule out its presence, the soft X-rays are well modeled by a combination of ionized reflection and leaked coronal emission described by the HXPL. The (narrow) Fe Kα line has an equivalent width of EW ~ 130 eV and is well described by xillver. No further line emission is required, indicating that the line is consistent with being completely due to reflection off Compton-thick material.
The complexity of our model leads us to study possible degeneracies by calculating Δχ2 contours for all pairs of time-dependent parameters. These contours show that the simultaneous fit is remarkably robust. As an example, Fig. 9 shows the contours for observation Suz 2. The overall correlations are similar for the other observations but differ in extent depending on the data S/N. A mild degeneracy between the covering factor with both the normalization and the photon index of the high-energy power law is present, as are modest degeneracies between the ionization state and the column density of the WA2 as well as the photon index and the normalization of the power law.
 |
Fig. 10 Contours relating all time-dependent parameters of all observations to NH of WA2. The solid, dashed, and dotted lines represent the 68%, 90%, and 99% confidence contours. Observations Suz 1 to Suz 6 are both marked with numbers and color-coded in black, blue, green, red, orange, and purple, respectively. |
The contours of xillver show an overall degeneracy with most other parameters, which can be removed by assuming that photon index is a time-independent parameter. Finally, turning to the time variability of the absorber, Fig. 10 shows the contours of all time-dependent parameters related to NH for all observations and in particular reveals a clear variability in column density across the observations. Note that the contours, including the normalization and ionization of the unblurred reflection component xillver, reveal no significant variability.
3.4. Analysis of Swift XRT data
For each Suzaku observation the archive contains two simultaneous Swift observations.
We model 2008 Swift XRT simultaneously with the same baseline spectral model (see Table 5) but independently of the simultaneous fit of the Suzaku data. Tests show that the Swift data are consistent with the Suzaku data and do not contribute additional information due to the lower effective area. We therefore impose constraints gained with Suzaku for certain parameters that can neither be constrained with Swift nor identified as variable with Suzaku. All derived parameters are consistent with those found for Suzaku data.
We also analyze the most recent Swift observations from 2013–2015. The data are well described with a single power law absorbed by both Galactic and intrinsic, neutral absorption modeled with tbnew. We find a very low degree of absorption (NH< 0.34 × 1022 cm-1) consistent with the predominant relatively unabsorbed state during the RXTE monitoring over 6.9 years.
4. Multiwavelength data analysis
4.1. Near-infrared–X-ray SED and reddening
The broadband spectral energy distribution (SED; Fig. 11) is based on Swift/UVOT data from the observation Sw 4a and allows us to estimate the amount of reddening due to dust in the line of sight and to draw conclusions on the dust content of the X-ray absorbing cloud. Model degeneracies, however, also require us to include data from other wavebands. These include photometric data from ground- and space-based facilities of different spatial resolutions and apertures: WISE (Wright et al. 2010) and 2MASS (Skrutskie et al. 2006) data from the All-Sky Source Catalogs, data (Ramos Almeida et al. 2011) from the NASA 3 m IRTF telescope (NSFCam at L-band), the 3.8 m UKIRT telescope (IRCAM3 at M-band), the Gemini-South telescope (T-ReCs, N-band) as well as HST NICMOS data in the filters F160W and F222M (Quillen et al. 1999), HST FGS data at F550W (Bentz et al. 2009), and HST ACS data at 3300 Å (Muñoz Marín et al. 2007). This last data point, taken in 2002, is roughly consistent with the UVOT flux taking the different spatial resolution into account as well as likely long-term source variability5.
 |
Fig. 11 Example SED of NGC 3227 illustrating the coverage from the MIR (WISE: red circles; Spitzer: purple circles; and HST: orange triangles) over the NIR (ground-based data: brown squares), the optical (2MASS: blue circles; HST) and UV (Swift/UVOT: turquoise circles) to the X-ray band up to 10 keV (Swift/XRT: green circles). The UV and X-ray data were simultaneously measured at 2008-11-21, while the 2MASS and WISE data are archival catalog data. The Spitzer data are simulated data based on the AGN contribution (Hernán-Caballero et al. 2015). Other data are nonsimultaneous photometric measurements from the literature. See text for details. The dashed lines correspond to the unabsorbed and unreddened model components, the thick solid line to the overall reddened and absorbed model. |
In addition, we simulate Spitzer data based on the AGN contribution to the IR, as modeled by Hernán-Caballero et al. (2015). A cross-calibration factor between WISE and Spitzer of 1.6 is consistent with flux calibration uncertainties and aperture effects (Hernán-Caballero et al. 2015). For modeling the continuum, we only take data with point spread functions (PSFs) comparable to those of Swift/UVOT into account, i.e., WISE, 2MASS data with PSFs of 5′′–10′′ radius, as well as Swift/XRT data. Systematic effects and model degeneracies due to aperture effects of the instruments and a lack of simultaneous data lead us to abstain from performing a statistical χ2 minimization at energies lower than X-rays. Instead, we use sub-arcsec Spitzer, HST, and the ground-based data, which are only sensitive to the AGN core, to constrain the AGN-related model components, i.e., the dusty torus and the accretion disk emission in the IR and UV, respectively. While the Swift data provide the only variability information on timescales of weeks, the X-ray band turns out to be the only band with strong variability and we can use the already known model between 0.6–10 keV. The IR–UV bands, in contrast, show only minor variability up to 25% on the timescales monitored by Swift/UVOT. In the following, we describe our best-fitting model for data below X-rays, for which we find χ2/ d.o.f. = 125 / 23.
The reprocessed MIR/NIR emission probed by Spitzer, ground-based and HST data at 1550 Å and 2300 Å have been fitted previously with clumpy torus models by, e.g., Ramos Almeida et al. (2011) or Alonso-Herrero et al. (2011). We instead use a phenomenological description of three blackbodies from 145 K up to 1480 K, which is supported by Calderone et al. (2012).
We account for the host galaxy starlight using a SWIRE6 template for a Sa spiral galaxy. The broadband template is constructed to match a stellar template spectrum (3500–7000 Å) by Winge et al. (1995) at 5500 Å for a normalization of one. Below 4000 Å, UVOT measures extra emission that can not be fitted with an accretion disk. According to Davies et al. (2006), the central 30 parsecs show remainders of starburst emission accounting for 20% to 60% of the galaxy’s bolometric luminosity. We therefore add a starburst template (Kinney et al. 1996) below 4000 Å. This is also confirmed by an independent photometric measurement of the starlight by HST at 3300 Å (lower triangle in Fig. 11), which perfectly matches the combined template for a normalization of one. We find a template normalization of ~4, which is due to uncertainties in the derivation of the stellar template and aperture effects.
The accretion disk emission is described with a multitemperature disk blackbody (diskpn, Tmax ~ 1 × 10⁵ K at rin = 6 rg reddened with a column of 1.2 × 1021 cm-2 or AV ~ 0.45 mag). Its normalization is constrained by HST data at 5470 Å and 3300 Å. The data were taken two years apart from each other, which can explain their scatter around the model. Koratkar & Blaes (1999) confirm that the value found for Tmax is consistent with sample studies of quasars with minimal extinction as well as the expected inner disk temperature of a thin α-disk. Degeneracies between the applied reddening and the inner disk temperature are reduced because of the consistency of the reddening column with results from the literature. According to Koratkar & Blaes (1999), one usually assumes extinctions of E(B − V) ~ 0.05–1 mag, (NH ~ 0.04 × 10²²−0.8 × 1022 cm-2 for a Galactic gas-to-dust ratio). According to Komossa & Fink (1997), Kraemer et al. (2000), Crenshaw et al. (2001), NGC 3227 has shown a rather large reddening column of ~0.2 × 1022 cm-2, which is claimed to be consistent with a persistent, dusty, “lukewarm” absorber at ~100 pc distance. Swift observations from 2013–2015 likely measure the same distant absorber but with only half the column, which is consistent with the reddening found in our model and possibly also by Winge et al. (1995).
Compared to the variable X-ray-absorbing column densities measured with Suzaku and Swift, the amount of UV extinction is associated with a column that is ~70 times smaller. Even for larger reddening and therefore larger inner disk temperatures, the severe mismatch to the X-ray column persists. This is unexpected if both the X-ray and UV absorber were of the same origin.
For the extinction at optical wavelengths (AV; Fitzpatrick 1999) we use the reddening-curve c(λ) from Crenshaw et al. (2001) that attenuates the intrinsic flux Fint according to 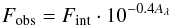 (2)with the extinction coefficient at the wavelength λ, Aλ = c(λ) E(B − V) = c(λ) AV/RV. We choose RV = 3.1 and estimate the equivalent column density via the assumed Galactic gas-to-dust ratio NH = AV·2.69 × 1021 cm-2 mag-1 (Nowak et al. 2012). Note that the standard Galactic reddening curve does not have to apply for the intrinsic absorber in NGC 3227, where dust grains might have a different composition and size distribution compared to the Galaxy (Crenshaw et al. 2001).
4.2. Optical polarimetry
A portion of the optical AGN emission undergoes scattering into our line of sight, resulting in a few percent of linear polarization. Investigations prefer the scenario of polar scattering for NGC 3227 (Smith et al. 2004). This result implies an intermediate inclination of the nucleus toward the line of sight, similar to what is predicted by clumpy torus models that are tested for NGC 3227 in Sect. 5.5. We therefore investigate additional optical polarimetric data coincident to the 2008 Swift/Suzaku campaign that have been taken between 2008 October 26 and 2008 December 03 with the 84 cm and 1.5 m telescopes of the San Pedro Mártir observatory (SPM) in Mexico. The data were taken with the B filter (Johnson system) as well as R and I filters (Cousins system), according to the standard photometric system (Bessell 2005). For the magnitude-flux conversion we use the zero-point magnitudes from Bessell et al. (1998).
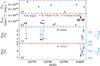 |
Fig. 12 a) Light curve of the unabsorbed X-ray luminosity in the 0.6–10 keV band; b) light curve of monochromatic luminosities in the B-band (blue circles), R-band (red triangles), and I-band (brown squares) for the 84 cm and 1.5 m SPM telescopes; the R-band and I-band luminosities are normalized to the weighted mean of the B-band with relative factors of 0.72 and 0.32, respectively; c) and d) degree of optical polarization popt (black squares) and electric vector position angle (PAopt, blue triangles) for the B/R-filters. The I-filter did not provide polarimetry data. The central wavelength of the B/R/I filters are given as 0.438 / 0.641 / 0.798 μm by Bessell et al. (1998). |
We compare the optical photometric luminosities with the X-ray luminosities in Fig. 12. The relatively sparse sampling pattern precludes a detailed cross-correlation analysis between the X-ray and optical light curves. The two bottom panels show polarimetry data for the B- and R-band. The degree of polarization p and the electric vector position angle (PA) scatter around a few percent and 100°–150°, respectively, which is roughly consistent with the results from Smith et al. (2004). They find that the PA is constant over wavelength with a value of PA ~ 135°. In contrast we observe different weighted averages between the B-band (PA ~ 140°) and R-band (PA ~ 119°). Mundell et al. (1995a) find both signatures for a narrow line region in high-excitation O iii emission lines (PA ~ 30°) and two compact radio cores along a PA of ~170°. Mundell et al. (1995b) identify a much more extended radio source with PA ~ 158°, which shows a rotating disk-like structure on scales of a typical host galaxy with an inclination of ~56°; any connection to the AGN on much smaller scales is not immediately obvious, especially given the uncertainty regarding the AGN system inclination. We support the suggestion of Mundell et al. (1995a) and Smith et al. (2004) that the cone of excited O iii gas may be oriented along the symmetry axis of the AGN. The angle enclosed between the cone and the measured average PA in the B-band is therefore ~102°, which is close to a PA of 90°. Along with the degree of polarization we therefore find the optical emission in NGC 3227 to be consistent with polar scattering, similar to that suggested by Smith et al. (2004).
When facing additional systematic uncertainties in the polarimetry data we cannot conclude any significant variability. The optical luminosities, in contrast, show less than 40% variability with systematics most likely affecting the I-band data point at MJD 54 796.7.
5. The properties and origin of the absorbing gas
5.1. Summary of observational results
The 6.9 years of sustained RXTE monitoring from 1999 Jan. to 2005 Dec (Rivers et al. 2011b) caught two discrete eclipses. The first ~80 d long event in 2000 was analyzed by Lamer et al. (2003) and is dominated by a low-ionization absorption component (log ξ ~ 0.4; WA1 in our model). The second event lasted 2–7 days and was also dominated by low-ionization or, at most, moderate-ionization gas (Markowitz et al. 2014). Based on this monitoring, the relatively unobscured observation by XMM-Newton in 2006 and recent Swift observations from 2013–2015, NGC 3227 was usually relatively unobscured before 2006 and after 2013. Thanks to these previous observations and in particular the 2008 Suzaku/Swift campaign, we can build a clearer picture of the behavior of the variable absorption components in NGC 3227 over the last 15 years and also address the properties and origin of the absorber during the 2008 campaign.
 |
Fig. 13 Evolution of the column density NH of WA2 over time as found in the Suzaku (black triangles) and Swift (gray circles) data. We plot uncertainties according to the 90% confidence level. The two data points derived by Swift that are cut off by the plotting window have the values |

During the 2008 campaign, the observed spectral variability was dominated by absorption due to moderately-ionized gas7 (log ξ ~ 1; WA2 in our baseline model) with a time-variable, complex and irregular density profile, and columns spanning ~5–16 × 1022 cm-2 (Fig. 13). The column densities derived by Swift are mostly consistent with those from Suzaku within 2σ. The event duration is ≥35 days. As a result of the lack of concurrent RXTE monitoring in 2008, we have no firm information on cloud ingress or egress.
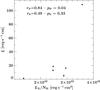 |
Fig. 14 Correlation between the ionization parameter ξ and the X-ray luminosity LX as a proxy for the ionizing luminosity. The numbers give the Pearson and Spearman rank correlation coefficients as well as null hypothesis probabilities. |
5.2. Luminosity and ionization
We now proceed to study further the nature and properties of WA2 by testing if there is any relation between its ionization state and the measured source properties.
Because of Eq. (1), we expect a linear relation between ξ and the ionizing luminosity. We first assume that the measured X-ray continuum is a direct proxy for the variation of the ionizing continuum, i.e., we assume that the measured X-ray luminosity by Suzaku, taken here from 0.6 keV to 10 keV, is directly proportional to the overall ionizing luminosity Lion. Figure 14 shows that there may be a trend in the data that higher luminosities also imply larger ξ. The Pearson correlation coefficient for ξ as a function of LX is rP,X = 0.70 with a null hypothesis probability of PP,X = 0.12. However, the Pearson correlation coefficient is sensitive to extreme outliers, i.e., the data from Suz 4. As a second check we also calculate the Spearman rank correlation coefficient, which is less sensitive to extreme outlying points than the Pearson coefficient. We find rS,X = 0.71 (PS,X = 0.11). The data thus do not allow us to claim a direct relation between ξ and LX; any correlation is tentative at best. More observations, especially at lower luminosity states, are needed.
5.3. The location of the absorber
Here we provide estimates of the distance of the variable absorber detected in the 2008 campaign from the SMBH. Throughout this section we make the simplified assumption that the mapped column density profile is due to a single spherical cloud of uniform density, illuminated by a central source and therefore ionized. For the ionization state and column density we use the average fit parameters from the Suzaku campaign, i.e., log ξ ~ 1.1 and NH ~ 11.2 × 1022 cm-2.
Many of the properties of the cloud also depend on the ionizing luminosity, Lion. As we showed above, there is only a tentative relation between the ionization parameter and the X-ray luminosity as proxy for the ionizing luminosity, i.e., the ionization state of the absorber is mainly determined by the source behavior in the UV, which is inaccessible to our measurements and hidden in model degeneracies. We can place a constraint on the source’s UV emission from the measured SED shown in Fig. 11.
To derive the ionizing luminosity between 13.6 eV and 13.6 keV (1–1000 Ryd), we assume that the UVOT data are nonvariable within the 2008 campaign. We find Lion = 8.9 × 1042 erg s-1 for the sum of the nonvariable disk blackbody and the average of the X-ray power laws of all observations. The average bolometric luminosity is measured as Lbol = 1.3 × 1043 erg s-1. Using the assumed black hole mass, we find an Eddington ratio of λEdd ~ 0.005.
The measured value of Lion is highly model dependent. We therefore compare our results with those of Vasudevan & Fabian (2009) and Vasudevan et al. (2010), who present strong sample studies for estimating the energy output of AGN but lack extended data coverage. They show that the ratio of the UV luminosity below 100 eV to the bolometric luminosity, 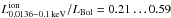 for values of the Eddington ratio λEdd = LBol/LEdd ranging from 0.01 to 0.61. In contrast to our study, Vasudevan et al. (2010) include nuclear IR emission in the bolometric luminosity LBol = 1043.5 erg s-1 for NGC 3227. Their lower black hole mass results in a higher Eddington ratio of λEdd = 0.039. We find via linear interpolation, that
  , which results in
 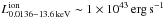 using our measured X-ray data. Considering the uncertainties of this method, this value is consistent with our result from a more complete SED in a single source study.
5.3.1. Constraints from the ionization parameter
We assume that the illuminated cloud is in photoionization equilibrium with the radiation field. Using the definition of ξ in Eq. (1)and estimating the particle density from the radial extent, ΔR (≤R), of the cloud, nH = NH/ ΔR, we find  (3)This yields an upper limit for the distance of the cloud of 2.2 pc (2938 ld) when using the average measured parameters.
5.3.2. Constraints from the photoionization equilibrium
Following Reynolds & Fabian (1995), we now combine the information we gain from Eq. (3)with requirements for the recombination timescale. As we assume that the absorber is in photoionization equilibrium with the radiation field, the recombination timescale of the plasma must be much smaller than the timescale of variations of the ionizing continuum. A direct test of this assumption would be measurements of a positive correlation between log ξ and Lion or LX. Figure 14 indeed shows a positive trend, but the correlation is weak. This can be explained with the assumption of a spherical cloud, which may be an oversimplification. Any variations of the extent or number density of the cloud can distort a direct correlation. Also, the ionizing luminosity cannot be measured directly, as the gap between the far-UV and soft X-rays is not observable. If the cloud reaches ionization equilibrium, the recombination timescale is given by (Blustin et al. 2005; Krolik 1999)  (4)where n9 = ne/ 109 cm-3 with ne is the electron particle density, and where αrec is the recombination rate coefficient, Z the atomic number of the ion, and T5 = T/ 105 K ~ 1, a representative value corresponding to gas with the ionization parameter log ξ ≳ 1 (Reynolds & Fabian 1995; Krolik & Kriss 2001; Chakravorty et al. 2009). We use Z = 9 to represent the likely dominant ions for WA2, O viii, and Ne ix (Kallman & Bautista 2001). In their study of warm absorber properties, Chakravorty et al. (2009) find that for typical AGN SEDs the log ξ/T–log T stability curves are independent of the hydrogen number density for 105 ≤ nH ≤ 1010 cm-3. Assuming solar abundances, ne = 1.2nH. Using these assumptions we find
  , suggesting recombination timescales easily less than hours to days for most densities of relevance here.
A further constraint on the density can be obtained from the observed variability of the absorber. The shortest timescales over which we can reliably measure changes in the illuminating flux and ionization in NGC 3227 is 7 days. The RXTE light curves indicate that NGC 3227’s X-ray flux typically varies by factors of a few tens of percent on timescales of 7 days and less (Uttley & McHardy 2005), which makes the assumption of photoionization balance a reasonable assumption. The weekly spaced Suzaku observations confirm this finding, while no variability is found within each of the observations with exception of Suz 1. The overall low variability is consistent with the assumption of photoionization balance, such that trec ≤ tvar = 7 d. This requirement can be translated to find a lower limit on the hydrogen number density from Eq. (4), 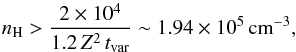 (5)which, in turn, sets an upper limit on the thickness of the absorbing layer,
  (6)Figure 15 helps us find an appropriate upper limit on the distance R of the absorber by considering the variation of log ΔR against log R (see also Reynolds & Fabian 1995). We can exclude three regions in the log R-log ΔR space (Fig. 15, light-red region). The first region is obtained using Eq. (6)with the assumed average NH of the absorbing cloud and the minimum hydrogen number density necessary to obtain ionization balance. In addition, we can also exclude a region where the basic assumption ΔR<R is violated. Since
  (7)and because NH = nHΔR, we can also find an upper limit for R. Inserting the average NH, ionization state, and luminosity measured with Suzaku gives the dashed line in Fig. 15. An upper limit for R can be derived from the intersecting point of Eqs. (6)and (7). As a result, the blank region includes all values of ΔR and R that come into consideration based on our spectral analysis, i.e., R ≲ 1018.3 cm = 0.65 pc = 770 ld (blue upper limit in Fig. 16), consistent with the dusty torus following Suganuma et al. (2006), Ramos Almeida et al. (2011) and our geometrical considerations in Eq. (3).
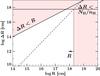 |
Fig. 15 Constraints on the radial distance R of the ionized absorbing material from the central engine visualized in the log R − log ΔR plane, where ΔR resembles the diameter of the intrinsic absorber. The regions filled with light red can be excluded based on spectral results of Suzaku and the relations denoted along the border lines. The dashed line follows the relation ΔR = NHR2ξ/Lion with the appropriate average parameters derived from spectral fits to all Suzaku observations. The intersecting points with lines where ΔR<NH/nH marks the upper limit on R. |
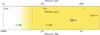 |
Fig. 16 Radial distribution of clumps that can potentially exist below and beyond the dust sublimation zone, i.e., 0.4 Rd–Rd (dashed lines). The distance limits from Sect. 5.3 are marked with colored arrows. For all estimates we use the average measured parameters of WA2 plus the average ionizing luminosity. The red upper limit from Sect. 5.3.1 uses the definition of the ionization parameter, while the blue upper limit from Sect. 5.3.2 is determined from geometrical constraints on a spherical homogeneous cloud in photoionization balance. The Keplerian orbital motion of this hypothetical cloud passing the line of sight is additionally included to form the lower limit in green (Sect. 5.3.3) while the second, larger lower limit in green is determined for an orbiting cloud neglecting the information on its ionization or column density. |
5.3.3. Constraints from a putative orbiting cloud
In this section we additionally consider the Keplerian orbital motion of an obscuring cloud that is illuminated by the central source while passing the line of sight in ≥35 d, equal to the duration of the campaign. We again use the average parameters NH, log ξ, and Lion. With these assumptions we can estimate the distance of this kind of cloud.
The first rough estimate is based on Risaliti et al. (2007, 2009a,b) and Lohfink et al. (2012), who discuss a spherical cloud that passes the line of sight. It is able to fully cover the central X-ray source, if it is larger than the diameter of the X-ray emitting corona ~10rg (Morgan et al. 2012) to five times this arbitrarily chosen value. This results in a lower limit for the distance of this kind of cloud of R ≳ 0.1 pc, marked as green lower limit in Fig. 16. Because of the complex shape of the NH profile, the underlying assumptions are probably too simple. The limit is also highly sensitive to the choice of the size of the X-ray emitting region.
This very rough estimate of the distance can be significantly improved when adding information about the average irradiating luminosity as well as column density and ionization state of the putative cloud. Writing the Kepler velocity as  and expressing nH in terms of the ionization parameter gives (Lamer et al. 2003)
  (8)With M7 = MBH/ 107M⊙ = 0.76, L42 = L/ 1042 erg s-1 = 8.9, N22 = NH/ 1022 cm-2 = 11.18, and Δt ≥ 35 d, we find R ≥ 0.017 pc = 20.7 ld. This lower limit is shown as additional green lower limit in Fig. 16.
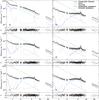 |
Fig. 17 Spectra and model components of all Suzaku observations. We show the complete model (black solid line) with residuals, the hard X-ray power law (dark green dashed line), the ionized reflection component (red dotted line), the emission absorbed by the variable partially covering column (blue dotted-dashed line) and the leaked emission (cyan double dotted-dashed line). |
Finally, we estimate the size ΔR of the assumed spherical cloud. Equating the Keplerian velocity with ΔR/ Δt = NH/nH Δt, we find  (9)Our distance estimates of 0.017–0.65 pc and the campaign-average value for NH, then yield number densities of nH ~ 2.7 × 10⁸–1.7 × 109 cm-3, consistent with the lower limit found from the recombination timescale analysis. This result translates to a range in the size of the absorbers of ΔR ~ 6.6 × 10¹³–4.1 × 1014 cm. Note that the column density profile has no defined ingress or egress. If we assume that the absorption by the cloud takes ≲2 years, i.e., the time interval between the absorbed observations and the 2006 unabsorbed XMM-Newton observation, the density would be about one order of magnitude less and its size accordingly larger.
5.4. A dust-free cloud located in the BLR?
The range of 0.017–0.65 pc found in the previous section means the possible location for the cloud spans radial distances both inside and outside the dust sublimation zone. Here, we define the dust sublimation zone to range from 0.4 Rd–Rd, with the dust sublimation radius,  (10)with an assumed bolometric luminosity of 1.3 × 1043 erg s-1 and a dust temperature of Td = 1500 K (Barvainis 1987; Nenkova et al. 2008b).
The result is consistent with Blustin et al. (2005), who determine the minimum and maximum distance of the absorbing gas solely based on geometrical considerations for a sample of 23 Seyfert galaxies of intermediate classification. Blustin et al. find that most low-velocity absorbers are consistent with the inner edge of the torus. Similarly, Risaliti et al. (2002) explain the column density variations of a large fraction of their Seyfert 2 sample sources with clouds at the inner edge of the dust sublimation zone.
We can test the dust content of the cloud using the reddening derived in Sect. 4.1. If the Galactic dust-to-gas ratio is applicable, the X-ray absorbing gas columns predict that we should see roughly AV ~ 20–60 mag of optical extinction. During the strong 2008 absorption event, however, we only measure a reddening of AV ~ 0.45 mag ~ 1.2 × 1021 cm-2.
There are several potential reasons for the lack of a strong dust component in the variable X-ray column density. First we consider a scenario where a cloud inside the line of sight to the X-ray source may indeed contain dust, but does not cover the line of sight to the UV continuum source. The diameter of a spherical cloud on a Keplerian orbit was determined in Sect. 5.3.3 to be ~6.6 × 10¹³–4.1 × 1014 cm. We now estimate the diameter of the UV emitting part of the accretion disk for comparison. The radial temperature profile of a standard thin disk is  (11)with the derived Eddington ratio λEdd = Lbol/LEdd = Ṁ/ṀEdd ~ 0.004, the black hole mass, and the radius of the UV emitting region. To solve the equation for R, we estimate the temperature at the outer UV emitting disk using the Wien displacement law and the longest wavelength Swift/UVOT filter. We find a radius of 1.1 × 1015 cm, i.e., larger than the estimated diameter range of a spherical, homogeneous X-ray absorbing cloud. In addition, McHardy et al. (2014), studying the interband time lags in NGC 5548, inferred that UV-emitting regions can extend slightly further than expected from standard α-disk theory, at least in that object. Consequently, based on our results, which assume a simple spherical cloud, we cannot rule out that the weak reddening is due to an X-ray absorbing cloud that fully covers the X-ray corona but not the entire UV-emitting disk.
A second possible reason for the low reddening is that the cloud does indeed contain dust but at an extremely high gas-to-dust ratio. With the results above, we find a gas-to-dust ratio of NH/AV ~ 2.5 × 1023 cm-2 mag-1, which is about a factor 100 higher than the assumed Galactic gas-to-dust ratio.
Finally, the low level of variability that we infer for the reddening supports the notion that the reddening matter has an origin, which is distinct from the much more strongly variable X-ray column. It is consistent with the distant, dusty, “lukewarm” absorber identified by Kraemer et al. (2000) and Crenshaw et al. (2001) as well as recent Swift observations. They therefore conclude that the X-ray absorbing gas is likely dust-free, which is supported by Sect. 5.3.3. We find that the absorber can be located well below the dust sublimation radius, and thus plausibly could be a BLR-cloud. The hydrogen number density range of 2.5 × 10⁸–1.5 × 109 cm-3 is consistent with the typical density of ≳109 cm-3 expected for BLR clouds (Baldwin et al. 2003; Osterbrock 1989).
5.5. The morphology and spatial distribution of a putative cloudy absorber
We now investigate the possibility for the detected absorber to be part of an overall clumpy medium.
According to the clumpy torus model of Nenkova et al. (2008a,b), the average number clouds along a line of sight with inclination i with respect to the system symmetry axis, NC, is given by ![\begin{equation} \label{eq:num_clouds} N_\mathrm{C}=N_0 \exp{\left[-\left(\frac{90-i}{\sigma}\right)^{2}\right]} , \end{equation}](/articles/aa/full_html/2015/12/aa26790-15/aa26790-15-eq372.png) (12)where N0 is the number of clouds along a ray in the equatorial plane between the Rd and YRd. The radial distribution of the clouds follows a power law r− q. This model has observational support from extensive time-resolved X-ray spectroscopy (Markowitz et al. 2014) and Bayesian model fits (Asensio Ramos & Ramos Almeida 2009) to IR SEDs (Ramos Almeida et al. 2011; Alonso-Herrero et al. 2011).
(12)where N0 is the number of clouds along a ray in the equatorial plane between the Rd and YRd. The radial distribution of the clouds follows a power law r− q. This model has observational support from extensive time-resolved X-ray spectroscopy (Markowitz et al. 2014) and Bayesian model fits (Asensio Ramos & Ramos Almeida 2009) to IR SEDs (Ramos Almeida et al. 2011; Alonso-Herrero et al. 2011).
Elitzur (2007) and Gaskell et al. (2008) claim that clouds can exist both in the BLR below, and in the dusty torus beyond Rd, all as part of a common structure. We therefore assume for simplicity that the power-law index q is the same for both the BLR and torus clouds, which yield a successively growing number of clouds toward the center. We assume the following mode values for the clumpy torus parameters from the posterior probability distributions of Alonso-Herrero et al. (2011): N0 = 15, Y = 15, q = 0.1, σ = 44° and i = 30°. They use IR photometry and additionally spectroscopic data around 10 μm. These values result in ~16 clouds in the equatorial plane between 0.4 and 15Rd. The lower limit equals the derived minimal distance of the absorber in NGC 3227. We call this number  , as it includes both dusty clouds detected in the IR and also dust-free clouds that additionally absorb X-rays. The number of clouds at the given inclination angle and width of the Gaussian cloud distribution then equals
  (Eq. (12)).
For comparison one can estimate the average number of clouds on the line of sight based on 6.9 years of sustained RXTE monitoring, the 2006 XMM-Newton observation, and the 35 days of Suzaku and Swift monitoring in 2008. During that time NGC 3227 was in an obscured state for a total of at least ~114 days. Based on the given data, NGC 3227 spends 4.4% of the observed time in eclipse.
Assuming Poisson statistics, the time averaged escape probability for photons without undergoing strong absorption by an average of  clouds in the line of sight is given by
 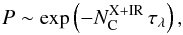 (13)where the monochromatic optical depth of one cloud, τλ ≳ 1 to be able to obscure the line of sight as observed during eclipses. With a 4.4% probability of obscuration, the integrated escape probability equals ~95.5%, i.e.,
  . This value is clearly lower than the average of 2.5 clouds estimated above.
One can still find consistency when considering severe degeneracies between different attempts of clumpy tori fits. Ramos Almeida et al. (2011), for example, only use IR photometry between 1–40 μm. They find much larger uncertainties and different mode values of N0 = 2, Y = 19, q = 0.6, σ = 33° and i = 66°. Based on these values we find  between 0.4 to 30 Rd; is consequently equal to 1.4. When inserting not only the mode values, but other values of high probability within the posterior probability distributions of the parameters, we can find consistency with the observed number of 0.045 clouds along the line of sight. If the inclination angle is even more face on, the number of clouds on the line of sight is also significantly reduced. Marin (2014) provides an overview over different methods and inclination angles measured so far. Hicks & Malkan (2008) and Fischer et al. (2013) indeed find a value of i ~ 16° using NIR spectroscopy consistent with Fischer et al. (2013), although results from optical polarimetry (Sect. 4.2) are more consistent with the intermediate inclinations derived from IR SED fitting.
We note that the fact that we obtain a larger number of clouds in the line of sight from extending the clumpy torus model than required from historical eclipse events is not inconsistent with the spectral results. Markowitz et al. (2009) show that even in a relatively unabsorbed state, ionized absorbers are present in the line of sight. Those could explain the determined excess of clouds.
5.6. The origin of the absorber
Here, we discuss the implications of the measured variable density profile of the absorber. Besides the highly variable column density over time, the covering fraction remains roughly constant for the latter five out of six Suzaku observations. This argues against two distinct clouds as an explanation for the two overdensities, but for a potential filament with a variable internal density structure that enters the line of sight. As a test, we can estimate the limiting size of one cloud, which is confined by its own magnetic field or the external pressure of the intercloud medium, not to get tidally sheared by the central force of gravity, to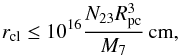 (14)(Elitzur & Shlosman 2006) where N23 = NH/ 1022 cm-2, Rpc = R/ 1 pc is the distance of the cloud to the central engine, and where M7 = MBH/ 107M☉. Inserting the average column density NH from the 2008 event and Rpc ~ 0.017–0.65, we find rcl ≤ 3.3 × 10¹⁰−1.8 × 1015 cm. For comparison, the estimated diameter of a spherical cloud on a Keplerian orbit was 6.6 × 1013 cm–4.1 × 1014 cm. Both ranges are consistent. Note, however, that the limiting size of the absorber, rcl, is strongly dependent on its distance. We can argue for a distance Rpc of the absorbing cloud toward the lower limit of allowed ranges when considering the weak reddened, implying a location inside the dust sublimation radius. In this case we would have to assume a rather extended and filamentary medium in contrast to the simplified picture of spherically symmetric clouds bound by self-gravity.
Mechanisms that are thought to be able to lead to these structures include MHD-driven winds that are launched from the accretion disk, for example, via magnetocentrifugally acceleration (Blandford & Payne 1982; Contopoulos & Lovelace 1994; Konigl & Kartje 1994). We find consistency between the measured ionization structure and column density of the absorber and the range of values simulated for MHD winds by Fukumura et al. (2010).
The absorber is also qualitatively consistent with the turbulent, dusty disk wind proposed by Czerny & Hryniewicz (2011). In this model, dusty clouds from the low-ionization part of the BLR can rise from the disk, e.g., driven by MHD forces, and get irradiated and heated sufficiently such that dust sublimates. Eventually clouds may fall back toward the disk when the gravitational force prevails over the driving forces. In this context, the absorbing cloud from 2008 may be just recently sublimated and temporarily situated at a height intercepting our line of sight.
The question remains how these driven clouds can get stretched out to filamentary structures of internal overdensities, which seem to best explain the observations. A potential mechanism is described by Emmering et al. (1992) in the context of MHD winds. As a wind or cloud forms, the material initially contains a high amount of dust, which is a good coolant via IR thermal emission. Once the clouds are driven away from the accretion disk they are heating up to ~104 K as the dust sublimes. After a cloud is photoionized, its internal pressure increases and expands at roughly its internal sound speed until its pressure decreases to roughly that exerted by the external magnetic field. Rees (1987) shows that the polodial magnetic field of the disk together with the internal field of magnetized BLR clouds can cause the expanded clouds to stretch out along the magnetic field, which is frozen in the disk.
Additionally we mention radiative driving of accretion disk winds. Dorodnitsyn & Kallman (2012) provide detailed simulations of how the X-ray radiation from the hot corona can be transferred to the IR by exerting pressure on dust and allowing clumpy or filamentary structures to arise. Again, the cloud or filament can be ionized by the nuclear radiation when reaching a certain height matching the observables of the absorber.
The 2008 absorption event might not be unique. Similar to the long-term obscurations of ~80 d and ≥35 d of NGC 3227 in 2000/2001 and 2008, respectively, NGC 5548 is continuously obscured for a few years (Kaastra et al. 2014). These phenomena may thus be typical to Seyfert galaxies, although the probability to observe them is low.
6. Summary and conclusions
We have studied data from a five- week-long Suzaku and Swift X-ray and UV monitoring campaign on the Sy 1.5 NGC 3227 in late 2008, which caught the source in an absorbed state. We performed time-resolved X-ray spectroscopy to untangle the various emission components, i.e., the coronal power law and ionized reflection as well as multiple ionized absorption components, and to isolate the time-dependent behavior of the dominant absorber in 2008. Past RXTE monitoring reveals NGC 3227 to be usually unabsorbed, except for eclipses in 2000/2001 (Lamer et al. 2003) and 2002 (Markowitz et al. 2014). The ultimate aim of this study is to understand the properties of the X-ray absorber.
We used two archival and previously published XMM-Newton spectra to derive a baseline model that we fit simultaneously to six Suzaku and 12 Swift observations from 2008. An extensive exploration of the parameter space reveals only minor degeneracies. The two XMM-Newton spectra allowed us to identify three differently ionized absorbers, called WA1 (low ionization), WA2 (moderate ionization), and WA3 (high ionization). We conclude that the detected absorption variability in 2008 is solely due to WA2, while WA1 and WA3 remain constant.
We resolve the column density and covering fraction of WA2 to be variable with time. The covering fraction rises from ~70% for the first Suzaku observation up to ~90% for the remaining five observations. The column density varies from ~5 to ~18 × 1022 cm-1 in a double-peaked density profile. The ionizing luminosity Lion and the ionization state ξ of WA2 are seen to vary by factors of 1.3 and 104, respectively. A correlation analysis shows a tentative dependence between ξ and Lion as a proxy for Lion.
We use the average parameters of WA2 (⟨ NH ⟩ ~ 11.2 × 1022 cm-2, ⟨ log ξ ⟩ ~ 1.1, ⟨ Lion ⟩ ~ 8.9 × 1042 erg s-1) during the ≥35 d long absorption event to estimate that the distance of the absorbing medium is between 0.017 and 0.65 pc from the central SMBH. Here we made use of all available information, which comprise the ionization state, column density, and minimal duration of the event as well as the incident irradiation. The underlying, simplified assumption is that of a spherical cloud on a Keplerian orbit around the illuminating source.
For the derived distance range we infer the hydrogen number density of the spherical cloud to be ~2.7 × 10⁸−1.7 × 109 cm-3. The cloud therefore has a diameter of ΔR ~ 6.6 × 10¹³−4.1 × 1014 cm. We conclude that the absorber may be located in the outermost dust free BLR or the inner dusty torus.
We find only moderate reddening in the Swift UVOT data, which is due to a column density of NH ~ 1.2 × 1021 cm-2. In contrast, we measure X-ray-absorbing column densities at about a factor of 100 larger. We conclude based on Sect. 5 that the X-ray absorber responsible for the variability in 2008 and the absorber responsible for extinction are distinct. The first seems to comprise a high gas-to-dust ratio due to its vicinity to the SMBH. A location in the BLR would be consistent with our results. The latter is consistent with the distant (100 pc) lukewarm absorber proposed by Kraemer et al. (2000) and Crenshaw et al. (2001), which still seems to be present in recent Swift observations.
We also investigated the measured absorber in the context of the clumpy absorber model of Nenkova et al. (2008a,b). The inferred distribution of clouds is consistent with the eclipses observed for NGC 3227. The result that the absorber is likely located in the BLR leads us to extend the distribution of clouds down to 0.4Rd. The consistency of the model with past observations and the 2008 event is in particular reached for small inclination angles (≲20–30°) of the putative clumpy torus that are measured by independent methods and help to explain the predominant lack of absorption in NGC 3227 during past observations.
A spherical cloud situated below the dust sublimation zone can most likely not withstand tidal shearing by the central source of gravity. Several mechanisms, including MHD driving, are able to lift an initially dusty cloud from the disk where it is getting exposed to nuclear radiation and therefore ionized. Pressure gradients potentially stretch the cloud preferably along the magnetic field lines frozen to the disk.
In that context, the observing campaign represents a series of snapshots of parts of a cloud or filament whose properties (size, density distribution) may be evolving over time. The density profile of this event contrasts with that of the 2000/2001 event, which showed a centrally symmetric profile and clear ingress and egress. We therefore conclude that NGC 3227 is a rare laboratory to study the range of physical processes that form and shape clouds or filaments.
Acknowledgments
This research was partially funded by a grant from the Bundesministerium für Wirtschaft und Technologie under Deutsches Zentrum für Luft- und Raumfahrt grant 50 OR 1311. We thank Mirko Krumpe and Robert Nikutta for reading the manuscript and giving very helpful comments. We made use of ISIS functions provided by ECAP/Remeis observatory and MIT (http://www.sternwarte.uni-erlangen.de/isis/) as well as the NASA/IPAC Extragalactic Database (NED), which is operated by the Jet Propulsion Laboratory, California Institute of Technology, under contract with the National Aeronautics and Space Administration. This work used data obtained with the Suzaku satellite, a collaborative mission between the space agencies of Japan (JAXA) and the USA (NASA), as well as data from the Swift satellite, a NASA mission managed by the Goddard Space Flight Center, XMM-Newton, an ESA science mission with instruments and contributions directly funded by ESA Member States and NASA, the Wide-field Infrared Survey Explorer, which is a joint project of the University of California, Los Angeles, and the Jet Propulsion Laboratory/California Institute of Technology, funded by NASA, and the Two Micron All Sky Survey, a joint project of the University of Massachusetts and the Infrared Processing and Analysis Center/California Institute of Technology, funded by NASA and the National Science Foundation. We also used observations made with the NASA/ESA Hubble Space Telescope, obtained from the data archive at the Space Telescope Science Institute. STScI is operated by the Association of Universities for Research in Astronomy, Inc. under NASA contract NAS 5-26555. The research is also based upon observations acquired at the Observatorio Astronómico Nacional in the Sierra San Pedro Mártir (OAN-SPM), Baja California, México. T.M. acknowledges support by UNAM-DGAPA Grant PAPIIT IN104113 and CONACyT Grant Científica Básica 179662. We thank J. E. Davis for the development of the slxfig module that has been used to prepare the figures in this work.
References
- Akylas, A., Georgantopoulos, I., Griffiths, R. G., et al. 2002, MNRAS, 332, L23 [NASA ADS] [CrossRef] [Google Scholar]
- Alonso-Herrero, A., Ramos Almeida, C., Mason, R., et al. 2011, ApJ, 736, 82 [NASA ADS] [CrossRef] [Google Scholar]
- Antonucci, R. 1993, ARA&A, 31, 473 [Google Scholar]
- Arav, N., Barlow, T. A., Laor, A., et al. 1998, MNRAS, 297, 990 [NASA ADS] [CrossRef] [Google Scholar]
- Asensio Ramos, A., & Ramos Almeida, C. 2009, ApJ, 696, 2075 [NASA ADS] [CrossRef] [Google Scholar]
- Baldwin, J. A., Ferland, G. J., Korista, K. T., et al. 2003, ApJ, 582, 590 [NASA ADS] [CrossRef] [Google Scholar]
- Barvainis, R. 1987, ApJ, 320, 537 [NASA ADS] [CrossRef] [Google Scholar]
- Bentz, M. C., Peterson, B. M., Netzer, H., et al. 2009, ApJ, 697, 160 [Google Scholar]
- Bessell, M. S. 2005, ARA&A, 43, 293 [NASA ADS] [CrossRef] [Google Scholar]
- Bessell, M. S., Castelli, F., & Plez, B. 1998, A&A, 333, 231 [NASA ADS] [Google Scholar]
- Beuchert, T., Wilms, J., Kadler, M., et al. 2013, ArXiv e-prints [arXiv:1309.6674] [Google Scholar]
- Blandford, R. D., & Payne, D. G. 1982, MNRAS, 199, 883 [NASA ADS] [CrossRef] [Google Scholar]
- Blustin, A. J., Page, M. J., Fuerst, S. V., et al. 2005, A&A, 431, 111 [NASA ADS] [CrossRef] [EDP Sciences] [Google Scholar]
- Burrows, D. N., Hill, J. E., Nousek, J. A., et al. 2005, Space Sci. Rev., 120, 165 [NASA ADS] [CrossRef] [Google Scholar]
- Calderone, G., Sbarrato, T., & Ghisellini, G. 2012, MNRAS, 425, L41 [NASA ADS] [CrossRef] [Google Scholar]
- Chakravorty, S., Kembhavi, A. K., Elvis, M., et al. 2009, MNRAS, 393, 83 [NASA ADS] [CrossRef] [Google Scholar]
- Contopoulos, J., & Lovelace, R. V. E. 1994, ApJ, 429, 139 [NASA ADS] [CrossRef] [Google Scholar]
- Crenshaw, D. M., Kraemer, S. B., Bruhweiler, F. C., & Ruiz, J. R. 2001, ApJ, 555, 633 [NASA ADS] [CrossRef] [Google Scholar]
- Czerny, B., & Hryniewicz, K. 2011, A&A, 525, L8 [NASA ADS] [CrossRef] [EDP Sciences] [Google Scholar]
- Davies, R. I., Thomas, J., Genzel, R., et al. 2006, ApJ, 646, 754 [NASA ADS] [CrossRef] [Google Scholar]
- de Vaucouleurs, G., de Vaucouleurs, A., Corwin, Jr., H. G., et al. 1991, Sky Telesc., 82, 621 [Google Scholar]
- Dorodnitsyn, A., & Kallman, T. 2012, ApJ, 761, 70 [CrossRef] [Google Scholar]
- Elitzur, M. 2007, in The Central Engine of Active Galactic Nuclei, eds. L. C. Ho, & J. M. Wang (San Francisco: ASP), ASP Conf. Ser., 373, 415 [Google Scholar]
- Elitzur, M., & Shlosman, I. 2006, ApJ, 648, L101 [NASA ADS] [CrossRef] [Google Scholar]
- Elvis, M., Risaliti, G., Nicastro, F., et al. 2004, ApJ, 615, L25 [NASA ADS] [CrossRef] [Google Scholar]
- Emmering, R. T., Blandford, R. D., & Shlosman, I. 1992, ApJ, 385, 460 [NASA ADS] [CrossRef] [Google Scholar]
- Fischer, T. C., Crenshaw, D. M., Kraemer, S. B., & Schmitt, H. R. 2013, ApJS, 209, 1 [NASA ADS] [CrossRef] [Google Scholar]
- Fitzpatrick, E. L. 1999, PASP, 111, 63 [NASA ADS] [CrossRef] [Google Scholar]
- Fukumura, K., Kazanas, D., Contopoulos, I., & Behar, E. 2010, ApJ, 715, 636 [NASA ADS] [CrossRef] [Google Scholar]
- García, J., Dauser, T., Reynolds, C. S., et al. 2013, ApJ, 768, 146 [NASA ADS] [CrossRef] [Google Scholar]
- Gaskell, C. M., Goosmann, R. W., & Klimek, E. S. 2008, Mem. Soc. Astron. It., 79, 1090 [NASA ADS] [Google Scholar]
- George, I. M., Turner, T. J., Netzer, H., et al. 1998, ApJS, 114, 73 [NASA ADS] [CrossRef] [Google Scholar]
- Ghisellini, G., Maraschi, L., & Tavecchio, F. 2009, MNRAS, 396, L105 [NASA ADS] [Google Scholar]
- Gofford, J., Reeves, J. N., Tombesi, F., et al. 2013, MNRAS, 430, 60 [Google Scholar]
- Guainazzi, M., Nicastro, F., Fiore, F., et al. 1998, MNRAS, 301, L1 [NASA ADS] [CrossRef] [Google Scholar]
- Hernán-Caballero, A., Alonso-Herrero, A., Hatziminaoglou, E., et al. 2015, ApJ, 803, 109 [NASA ADS] [CrossRef] [Google Scholar]
- Hicks, E. K. S., & Malkan, M. A. 2008, ApJS, 174, 31 [NASA ADS] [CrossRef] [Google Scholar]
- Houck, J. C., & Denicola, L. A. 2000, in Astronomical Data Analysis Software and Systems IX, eds. N. Manset, C. Veillet, & D. Crabtree (San Francisco), ASP Conf. Ser., 216, 591 [Google Scholar]
- Kaastra, J. S., Kriss, G. A., Cappi, M., et al. 2014, Science, 345, 64 [NASA ADS] [CrossRef] [Google Scholar]
- Kalberla, P. M. W., Burton, W. B., Hartmann, D., et al. 2005, A&A, 440, 775 [NASA ADS] [CrossRef] [EDP Sciences] [Google Scholar]
- Kallman, T., & Bautista, M. 2001, ApJS, 133, 221 [NASA ADS] [CrossRef] [Google Scholar]
- Kinney, A. L., Calzetti, D., Bohlin, R. C., et al. 1996, ApJ, 467, 38 [NASA ADS] [CrossRef] [Google Scholar]
- Komossa, S., & Fink, H. 1997, A&A, 327, 483 [NASA ADS] [Google Scholar]
- Konigl, A., & Kartje, J. F. 1994, ApJ, 434, 446 [NASA ADS] [CrossRef] [Google Scholar]
- Koratkar, A., & Blaes, O. 1999, PASP, 111, 1 [NASA ADS] [CrossRef] [Google Scholar]
- Koyama, K., Tsunemi, H., Dotani, T., et al. 2007, PASJ, 59, 23 [Google Scholar]
- Kraemer, S. B., George, I. M., Turner, T. J., & Crenshaw, D. M. 2000, ApJ, 535, 53 [NASA ADS] [CrossRef] [Google Scholar]
- Krolik, J. H. 1999, Active Galactic Nuclei (Princeton, NJ: Princeton Univ. Press) [Google Scholar]
- Krolik, J. H., & Kriss, G. A. 2001, ApJ, 561, 684 [NASA ADS] [CrossRef] [Google Scholar]
- Krongold, Y., Nicastro, F., Elvis, M., et al. 2007, ApJ, 659, 1022 [NASA ADS] [CrossRef] [Google Scholar]
- Kühnel, M., Müller, S., Kreykenbohm, I., et al. 2015, Acta Pol., 55, 1 [CrossRef] [Google Scholar]
- Lamer, G., Uttley, P., & McHardy, I. M. 2003, MNRAS, 342, L41 [NASA ADS] [CrossRef] [Google Scholar]
- Landt, H., Bentz, M. C., Ward, M. J., et al. 2008, ApJS, 174, 282 [NASA ADS] [CrossRef] [Google Scholar]
- Lohfink, A. M., Reynolds, C. S., Mushotzky, R. F., & Wilms, J. 2012, ApJ, 749, L31 [NASA ADS] [CrossRef] [Google Scholar]
- Maiolino, R., Risaliti, G., Salvati, M., et al. 2010, A&A, 517, A47 [NASA ADS] [CrossRef] [EDP Sciences] [Google Scholar]
- Marin, F. 2014, MNRAS, 441, 551 [NASA ADS] [CrossRef] [Google Scholar]
- Markowitz, A., Reeves, J. N., George, I. M., et al. 2009, ApJ, 691, 922 [NASA ADS] [CrossRef] [Google Scholar]
- Markowitz, A. G., Krumpe, M., & Nikutta, R. 2014, MNRAS, 439, 1403 [NASA ADS] [CrossRef] [Google Scholar]
- McHardy, I. M., Cameron, D. T., Dwelly, T., et al. 2014, MNRAS, 444, 1469 [NASA ADS] [CrossRef] [Google Scholar]
- McKernan, B., & Yaqoob, T. 1998, ApJ, 501, L29 [NASA ADS] [CrossRef] [Google Scholar]
- Morgan, C. W., Hainline, L. J., Chen, B., et al. 2012, ApJ, 756, 52 [NASA ADS] [CrossRef] [Google Scholar]
- Mould, J. R., Huchra, J. P., Freedman, W. L., et al. 2000, ApJ, 529, 786 [NASA ADS] [CrossRef] [Google Scholar]
- Muñoz Marín, V. M., González Delgado, R. M., Schmitt, H. R., et al. 2007, AJ, 134, 648 [NASA ADS] [CrossRef] [Google Scholar]
- Mundell, C. G., Holloway, A. J., Pedlar, A., et al. 1995a, MNRAS, 275, 67 [NASA ADS] [Google Scholar]
- Mundell, C. G., Pedlar, A., Axon, D. J., et al. 1995b, MNRAS, 277, 641 [NASA ADS] [CrossRef] [Google Scholar]
- Nenkova, M., Ivezić, Ž., & Elitzur, M. 2002, ApJ, 570, L9 [NASA ADS] [CrossRef] [Google Scholar]
- Nenkova, M., Sirocky, M. M., Ivezić, Ž., Elitzur, M. 2008a, ApJ, 685, 147 [NASA ADS] [CrossRef] [Google Scholar]
- Nenkova, M., Sirocky, M. M., Nikutta, R., et al. 2008b, ApJ, 685, 160 [NASA ADS] [CrossRef] [Google Scholar]
- Nowak, M. A., Neilsen, J., Markoff, S. B., et al. 2012, ApJ, 759, 95 [NASA ADS] [CrossRef] [Google Scholar]
- Osterbrock, D. E. 1989, Astrophysics of gaseous nebulae and active galactic nuclei (Mill Valley, CA: University Science Books) [Google Scholar]
- Peterson, B. M., Ferrarese, L., Gilbert, K. M., et al. 2004, ApJ, 613, 682 [NASA ADS] [CrossRef] [Google Scholar]
- Quillen, A. C., Alonso-Herrero, A., Rieke, M. J., et al. 1999, ApJ, 527, 696 [NASA ADS] [CrossRef] [Google Scholar]
- Ramos Almeida, C., Levenson, N. A., Alonso-Herrero, A., et al. 2011, ApJ, 731, 92 [NASA ADS] [CrossRef] [Google Scholar]
- Rees, M. J. 1987, MNRAS, 228, 47P [NASA ADS] [CrossRef] [Google Scholar]
- Reynolds, C. S., & Fabian, A. C. 1995, MNRAS, 273, 1176 [Google Scholar]
- Risaliti, G., Elvis, M., & Nicastro, F. 2002, ApJ, 571, 234 [NASA ADS] [CrossRef] [Google Scholar]
- Risaliti, G., Elvis, M., Fabbiano, G., et al. 2007, ApJ, 659, L111 [NASA ADS] [CrossRef] [Google Scholar]
- Risaliti, G., Miniutti, G., Elvis, M., et al. 2009a, ApJ, 696, 160 [NASA ADS] [CrossRef] [Google Scholar]
- Risaliti, G., Salvati, M., Elvis, M., et al. 2009b, MNRAS, 393, L1 [NASA ADS] [CrossRef] [Google Scholar]
- Risaliti, G., Nardini, E., Salvati, M., et al. 2011, MNRAS, 410, 1027 [NASA ADS] [CrossRef] [Google Scholar]
- Rivers, E., Markowitz, A., & Rothschild, R. 2011a, ApJ, 742, L29 [NASA ADS] [CrossRef] [Google Scholar]
- Rivers, E., Markowitz, A., & Rothschild, R. 2011b, ApJS, 193, 3 [NASA ADS] [CrossRef] [Google Scholar]
- Roming, P. W. A., Kennedy, T. E., Mason, K. O., et al. 2005, Space Sci. Rev., 120, 95 [NASA ADS] [CrossRef] [Google Scholar]
- Skrutskie, M. F., Cutri, R. M., Stiening, R., et al. 2006, AJ, 131, 1163 [NASA ADS] [CrossRef] [Google Scholar]
- Smith, J. E., Robinson, A., Alexander, D. M., et al. 2004, MNRAS, 350, 140 [Google Scholar]
- Stalevski, M., Fritz, J., Baes, M., et al. 2012, MNRAS, 420, 2756 [NASA ADS] [CrossRef] [Google Scholar]
- Strüder, L., Briel, U., Dennerl, K., et al. 2001, A&A, 365, L18 [NASA ADS] [CrossRef] [EDP Sciences] [Google Scholar]
- Suganuma, M., Yoshii, Y., Kobayashi, Y., et al. 2006, ApJ, 639, 46 [NASA ADS] [CrossRef] [Google Scholar]
- Takahashi, T., Abe, K., Endo, M., et al. 2007, PASJ, 59, 35 [NASA ADS] [CrossRef] [EDP Sciences] [Google Scholar]
- Tarter, C. B., Tucker, W. H., & Salpeter, E. E. 1969, ApJ, 156, 943 [NASA ADS] [CrossRef] [Google Scholar]
- Tombesi, F., Cappi, M., Reeves, J. N., et al. 2013, MNRAS, 430, 1102 [Google Scholar]
- Turner, M. J. L., Abbey, A., Arnaud, M., et al. 2001, A&A, 365, L27 [NASA ADS] [CrossRef] [EDP Sciences] [Google Scholar]
- Turner, T. J., Reeves, J. N., Kraemer, S. B., & Miller, L. 2008, A&A, 483, 161 [NASA ADS] [CrossRef] [EDP Sciences] [Google Scholar]
- Uttley, P., & McHardy, I. M. 2005, MNRAS, 363, 586 [NASA ADS] [CrossRef] [Google Scholar]
- Vasudevan, R. V., & Fabian, A. C. 2009, MNRAS, 392, 1124 [NASA ADS] [CrossRef] [Google Scholar]
- Vasudevan, R. V., Fabian, A. C., Gandhi, P., et al. 2010, MNRAS, 402, 1081 [NASA ADS] [CrossRef] [Google Scholar]
- Verner, D. A., Ferland, G. J., Korista, K. T., & Yakovlev, D. G. 1996, ApJ, 465, 487 [NASA ADS] [CrossRef] [Google Scholar]
- Wilms, J., Allen, A., & McCray, R. 2000, ApJ, 542, 914 [NASA ADS] [CrossRef] [Google Scholar]
- Winge, C., Peterson, B. M., Horne, K., et al. 1995, ApJ, 445, 680 [NASA ADS] [CrossRef] [Google Scholar]
- Wright, E. L., Eisenhardt, P. R. M., Mainzer, A. K., et al. 2010, AJ, 140, 1868 [NASA ADS] [CrossRef] [Google Scholar]
All Tables
Continuum parameters of the spectral fit of the baseline model to the relatively unabsorbed 2006 XMM-Newton observation.
Continuum parameters of the spectral fit of the derived baseline model to the absorbed 2000 XMM-Newton observation.
List of parameters for the simultaneous fit of observations Suz 2 to Suz 6 and the individual fit of the observation Suz 1.
All Figures
|
Fig. 1 Timeline including all observations of NGC 3227 discussed here. The blue region shows the time range of sustained RXTE monitoring from 1999-Jan-02 to 2005-Dec-04 (Uttley & McHardy 2005). The observations by Suzaku and Swift from the 2008 campaign are marked in red; the times of the XMM-Newton and recent Swift observations are shown in blue. |
| In the text | |
|
Fig. 2 Example of the steps followed to find the best-fit baseline model on the Suzaku spectra (we use observation Suz 3 in this example). a) Fit to the spectrum with a single power law absorbed by neutral gas. b) The neutral absorber is partially covering the incident power law. c) As a result of characteristic residuals, we replace the solely neutral absorber by an ionized absorber; and d) two more warm absorbers leading to a stratified composite of differently ionized absorbers. e) The remaining residuals in the soft band and around 6.4 keV are flattened when finally adding a reflected power law in panel. |
| In the text | |
|
Fig. 3 The 2006 (top) and 2000 (bottom) XMM-Newton spectra, the best-fit model components, and the complete model shown with thick and thin solid lines, respectively. Both spectra are described by the baseline model that comprises a high-energy X-ray power law with a reflection component and absorption by three layers of low-, moderate- and high-ionization gas as well as a Galactic column. The source is partially covered by WA2 for the 2006 and by WA1 for the 2000 observation. The data from 2006 also require a steep soft excess. The sharp residuals at ~1.85 keV are likely due to calibration uncertainties around the Si K edge. |
| In the text | |
|
Fig. 4 Comparison of the 2006 XMM-Newton and Suz 1 observations in the 0.5–2.3 keV range. The gray area marks the energy range comprising two modest absorption features that are due to an absorber of similar ξ, i.e., WA2. |
| In the text | |
|
Fig. 5 Effect of WA3 if it were to fully cover the background power law. The warm absorber of observation Suz 1 is shown in red; black shows the effect of the absorber found in the remaining Suzaku observations. |
| In the text | |
|
Fig. 6 Temporal evolution of the parameters describing the variable moderately ionized absorber WA2 and the luminosity in the 0.6–10 keV X-ray band for the six Suzaku observations. |
| In the text | |
|
Fig. 7 Effect of the partial coverer WA2 onto a power law (thick lines with line styles given in the figure) as part of the best-fit model (Fig. 8). The thin and solid lines of lighter color show the effect the coverer would have if it were to fully cover the source. |
| In the text | |
|
Fig. 8 Spectra and residuals in units of standard deviations for a fit of the baseline model to the Suzaku spectra of the 2008 campaign (Table 4). A single fit is performed for the high state observation (Suz 1), while the remaining observations (Suz 2–Suz 6) are fitted as part of one simultaneous fit with tied time-independent parameters. The statistics printed in the residual panels correspond to the best-fit on each observation, using the appropriate time-dependent parameters. |
| In the text | |
|
Fig. 9 Color-coded Δχ2 contours for relevant spectral parameters of Suz 2. The 68.27%, 90%, and 99% contours correspond to the solid, dashed, and dotted lines. The color code ranges from brown (small Δχ2) up to dark blue (large Δχ2). |
| In the text | |
|
Fig. 10 Contours relating all time-dependent parameters of all observations to NH of WA2. The solid, dashed, and dotted lines represent the 68%, 90%, and 99% confidence contours. Observations Suz 1 to Suz 6 are both marked with numbers and color-coded in black, blue, green, red, orange, and purple, respectively. |
| In the text | |
|
Fig. 11 Example SED of NGC 3227 illustrating the coverage from the MIR (WISE: red circles; Spitzer: purple circles; and HST: orange triangles) over the NIR (ground-based data: brown squares), the optical (2MASS: blue circles; HST) and UV (Swift/UVOT: turquoise circles) to the X-ray band up to 10 keV (Swift/XRT: green circles). The UV and X-ray data were simultaneously measured at 2008-11-21, while the 2MASS and WISE data are archival catalog data. The Spitzer data are simulated data based on the AGN contribution (Hernán-Caballero et al. 2015). Other data are nonsimultaneous photometric measurements from the literature. See text for details. The dashed lines correspond to the unabsorbed and unreddened model components, the thick solid line to the overall reddened and absorbed model. |
| In the text | |
|
Fig. 12 a) Light curve of the unabsorbed X-ray luminosity in the 0.6–10 keV band; b) light curve of monochromatic luminosities in the B-band (blue circles), R-band (red triangles), and I-band (brown squares) for the 84 cm and 1.5 m SPM telescopes; the R-band and I-band luminosities are normalized to the weighted mean of the B-band with relative factors of 0.72 and 0.32, respectively; c) and d) degree of optical polarization popt (black squares) and electric vector position angle (PAopt, blue triangles) for the B/R-filters. The I-filter did not provide polarimetry data. The central wavelength of the B/R/I filters are given as 0.438 / 0.641 / 0.798 μm by Bessell et al. (1998). |
| In the text | |
|
Fig. 13 Evolution of the column density NH of WA2 over time as found in the Suzaku (black triangles) and Swift (gray circles) data. We plot uncertainties according to the 90% confidence level. The two data points derived by Swift that are cut off by the plotting window have the values |
| In the text | |
|
Fig. 14 Correlation between the ionization parameter ξ and the X-ray luminosity LX as a proxy for the ionizing luminosity. The numbers give the Pearson and Spearman rank correlation coefficients as well as null hypothesis probabilities. |
| In the text | |
|
Fig. 15 Constraints on the radial distance R of the ionized absorbing material from the central engine visualized in the log R − log ΔR plane, where ΔR resembles the diameter of the intrinsic absorber. The regions filled with light red can be excluded based on spectral results of Suzaku and the relations denoted along the border lines. The dashed line follows the relation ΔR = NHR2ξ/Lion with the appropriate average parameters derived from spectral fits to all Suzaku observations. The intersecting points with lines where ΔR<NH/nH marks the upper limit on R. |
| In the text | |
|
Fig. 16 Radial distribution of clumps that can potentially exist below and beyond the dust sublimation zone, i.e., 0.4 Rd–Rd (dashed lines). The distance limits from Sect. 5.3 are marked with colored arrows. For all estimates we use the average measured parameters of WA2 plus the average ionizing luminosity. The red upper limit from Sect. 5.3.1 uses the definition of the ionization parameter, while the blue upper limit from Sect. 5.3.2 is determined from geometrical constraints on a spherical homogeneous cloud in photoionization balance. The Keplerian orbital motion of this hypothetical cloud passing the line of sight is additionally included to form the lower limit in green (Sect. 5.3.3) while the second, larger lower limit in green is determined for an orbiting cloud neglecting the information on its ionization or column density. |
| In the text | |
|
Fig. 17 Spectra and model components of all Suzaku observations. We show the complete model (black solid line) with residuals, the hard X-ray power law (dark green dashed line), the ionized reflection component (red dotted line), the emission absorbed by the variable partially covering column (blue dotted-dashed line) and the leaked emission (cyan double dotted-dashed line). |
| In the text | |
Current usage metrics show cumulative count of Article Views (full-text article views including HTML views, PDF and ePub downloads, according to the available data) and Abstracts Views on Vision4Press platform.
Data correspond to usage on the plateform after 2015. The current usage metrics is available 48-96 hours after online publication and is updated daily on week days.
Initial download of the metrics may take a while.