Fig. 1
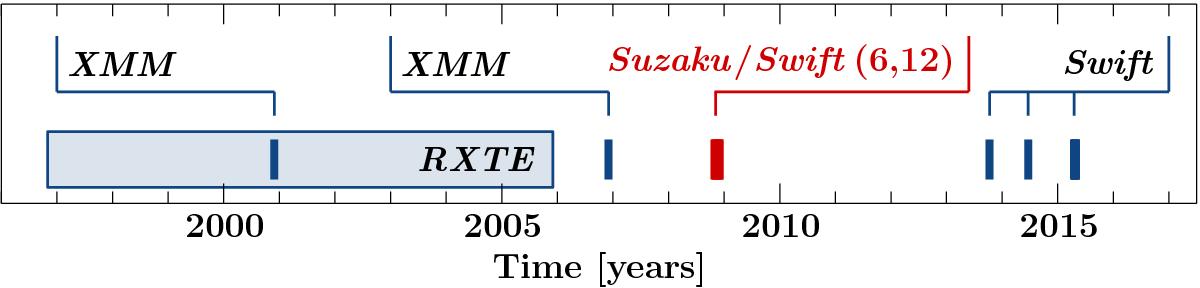
Timeline including all observations of NGC 3227 discussed here. The blue region shows the time range of sustained RXTE monitoring from 1999-Jan-02 to 2005-Dec-04 (Uttley & McHardy 2005). The observations by Suzaku and Swift from the 2008 campaign are marked in red; the times of the XMM-Newton and recent Swift observations are shown in blue.
Current usage metrics show cumulative count of Article Views (full-text article views including HTML views, PDF and ePub downloads, according to the available data) and Abstracts Views on Vision4Press platform.
Data correspond to usage on the plateform after 2015. The current usage metrics is available 48-96 hours after online publication and is updated daily on week days.
Initial download of the metrics may take a while.