Fig. 8
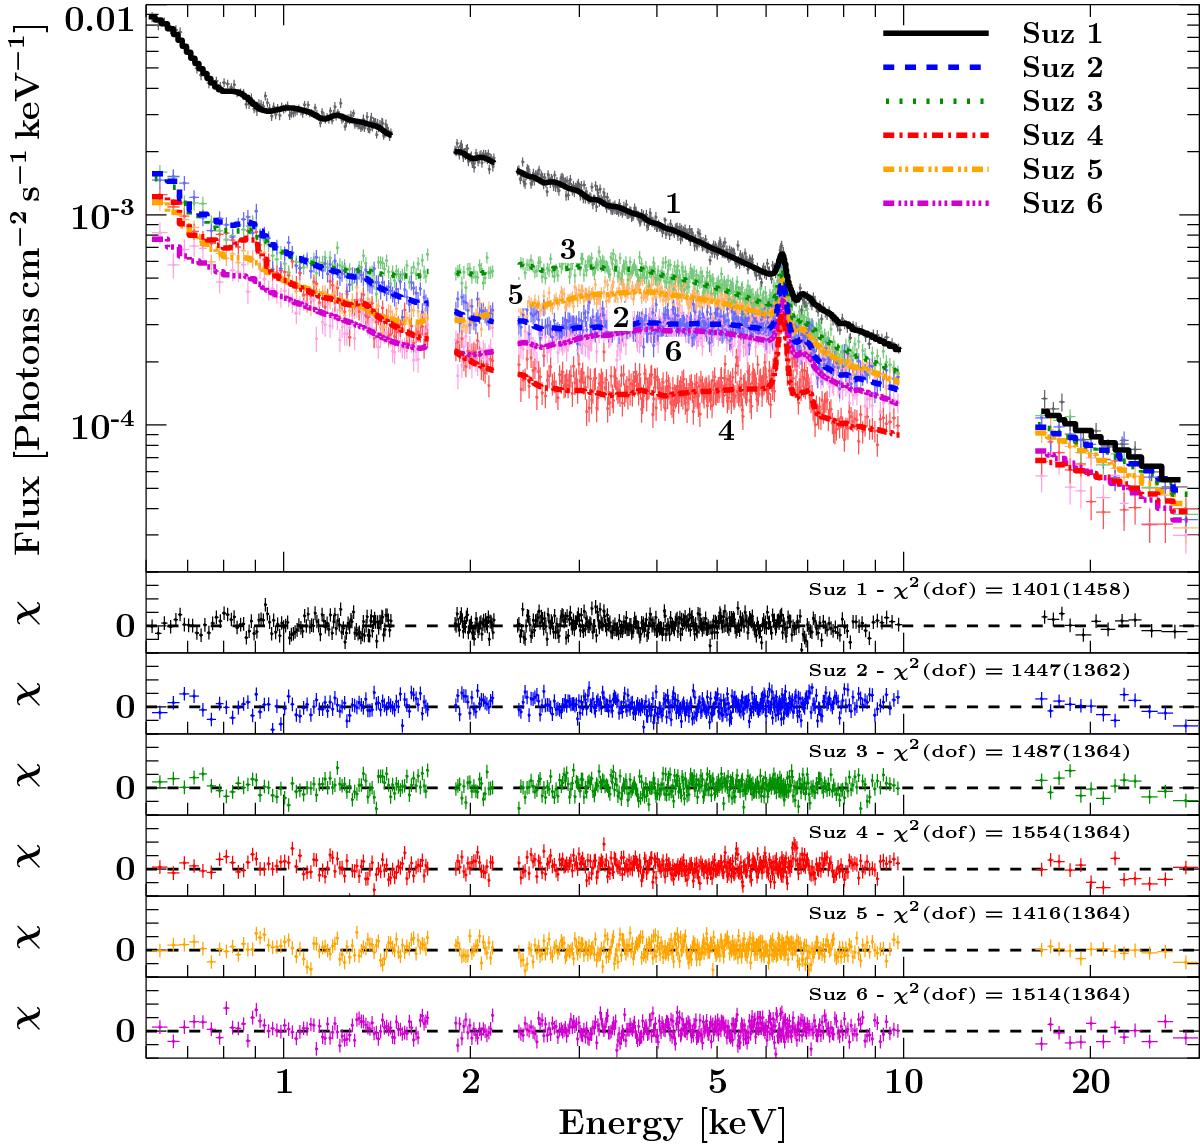
Spectra and residuals in units of standard deviations for a fit of the baseline model to the Suzaku spectra of the 2008 campaign (Table 4). A single fit is performed for the high state observation (Suz 1), while the remaining observations (Suz 2–Suz 6) are fitted as part of one simultaneous fit with tied time-independent parameters. The statistics printed in the residual panels correspond to the best-fit on each observation, using the appropriate time-dependent parameters.
Current usage metrics show cumulative count of Article Views (full-text article views including HTML views, PDF and ePub downloads, according to the available data) and Abstracts Views on Vision4Press platform.
Data correspond to usage on the plateform after 2015. The current usage metrics is available 48-96 hours after online publication and is updated daily on week days.
Initial download of the metrics may take a while.