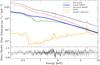
Fig. 3

The 2006 (top) and 2000 (bottom) XMM-Newton spectra, the best-fit model components, and the complete model shown with thick and thin solid lines, respectively. Both spectra are described by the baseline model that comprises a high-energy X-ray power law with a reflection component and absorption by three layers of low-, moderate- and high-ionization gas as well as a Galactic column. The source is partially covered by WA2 for the 2006 and by WA1 for the 2000 observation. The data from 2006 also require a steep soft excess. The sharp residuals at ~1.85 keV are likely due to calibration uncertainties around the Si K edge.
Current usage metrics show cumulative count of Article Views (full-text article views including HTML views, PDF and ePub downloads, according to the available data) and Abstracts Views on Vision4Press platform.
Data correspond to usage on the plateform after 2015. The current usage metrics is available 48-96 hours after online publication and is updated daily on week days.
Initial download of the metrics may take a while.