Free Access
Fig. 8
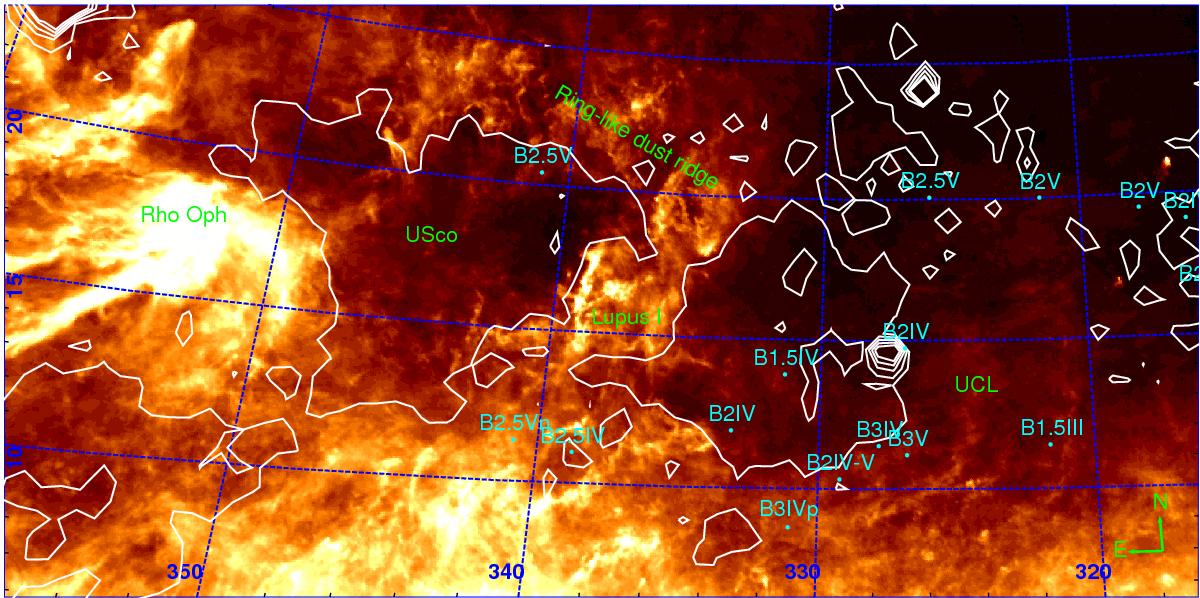
Surroundings of Lupus I seen in dust emission (Planck 350 μm). The white contours mark the X-ray emission (ROSAT 0.8 keV) from 0.27−1 × 10⁻³ counts/s. The cyan dots mark the positions of the B1-B3 stars of UCL from the Hipparcos catalog. Labels are given in green.
Current usage metrics show cumulative count of Article Views (full-text article views including HTML views, PDF and ePub downloads, according to the available data) and Abstracts Views on Vision4Press platform.
Data correspond to usage on the plateform after 2015. The current usage metrics is available 48-96 hours after online publication and is updated daily on week days.
Initial download of the metrics may take a while.