Free Access
Fig. 6
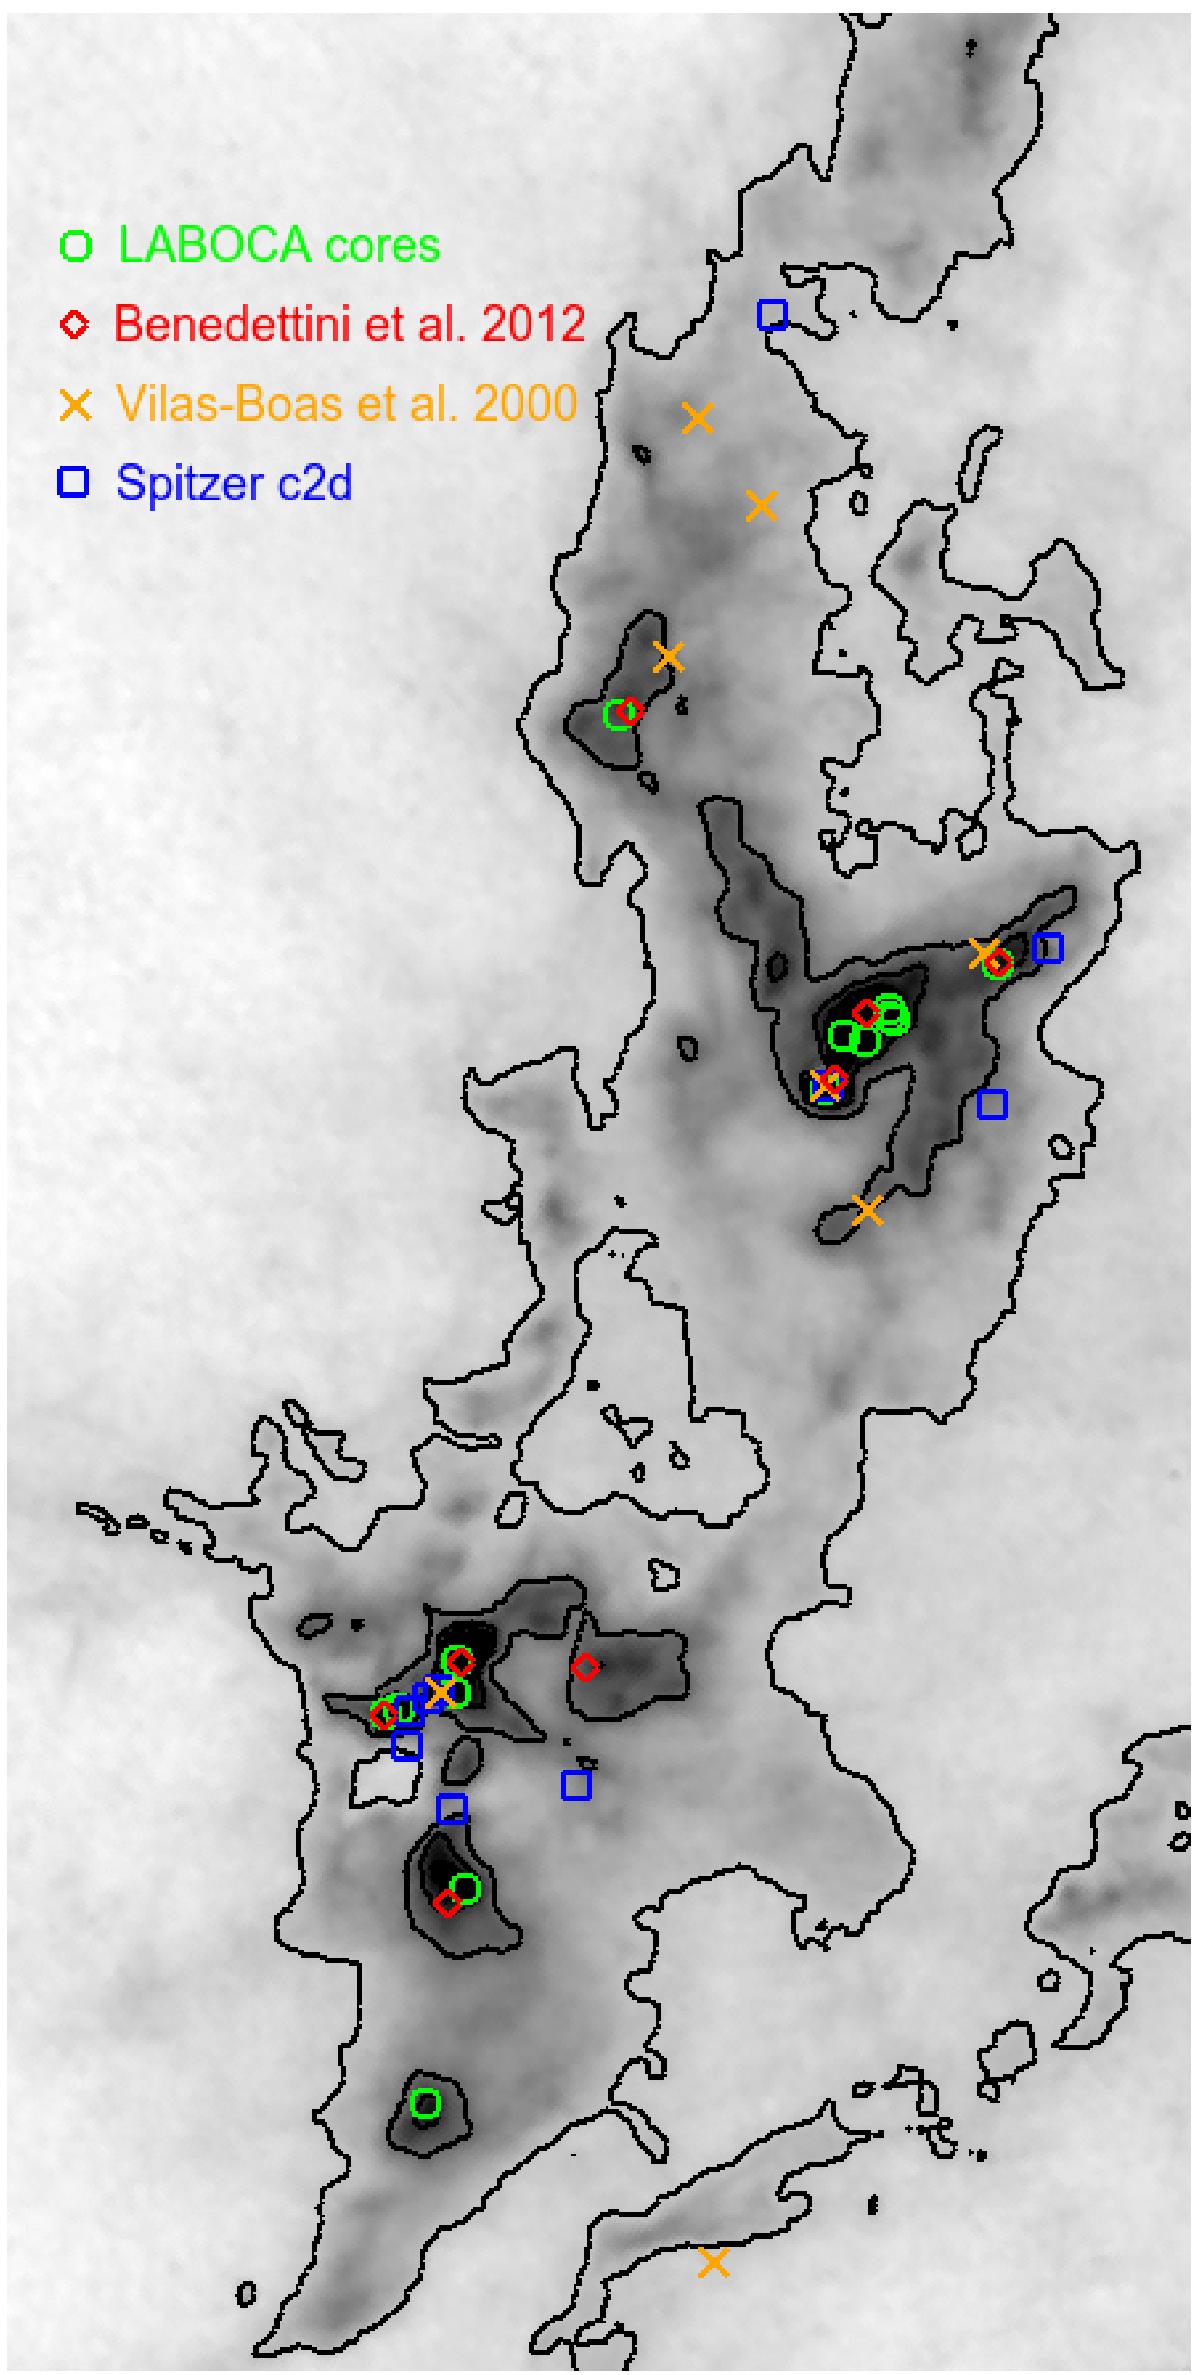
Herschel column density map of the center-south region with contour levels of 1.1, 4, 7, and 10 × 1021 cm-2. The different symbols mark the center positions of the cores found with LABOCA and of objects found in other studies as discussed in Sect. 4.3.
Current usage metrics show cumulative count of Article Views (full-text article views including HTML views, PDF and ePub downloads, according to the available data) and Abstracts Views on Vision4Press platform.
Data correspond to usage on the plateform after 2015. The current usage metrics is available 48-96 hours after online publication and is updated daily on week days.
Initial download of the metrics may take a while.