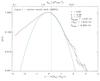
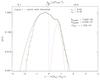
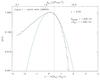
Fig. 5
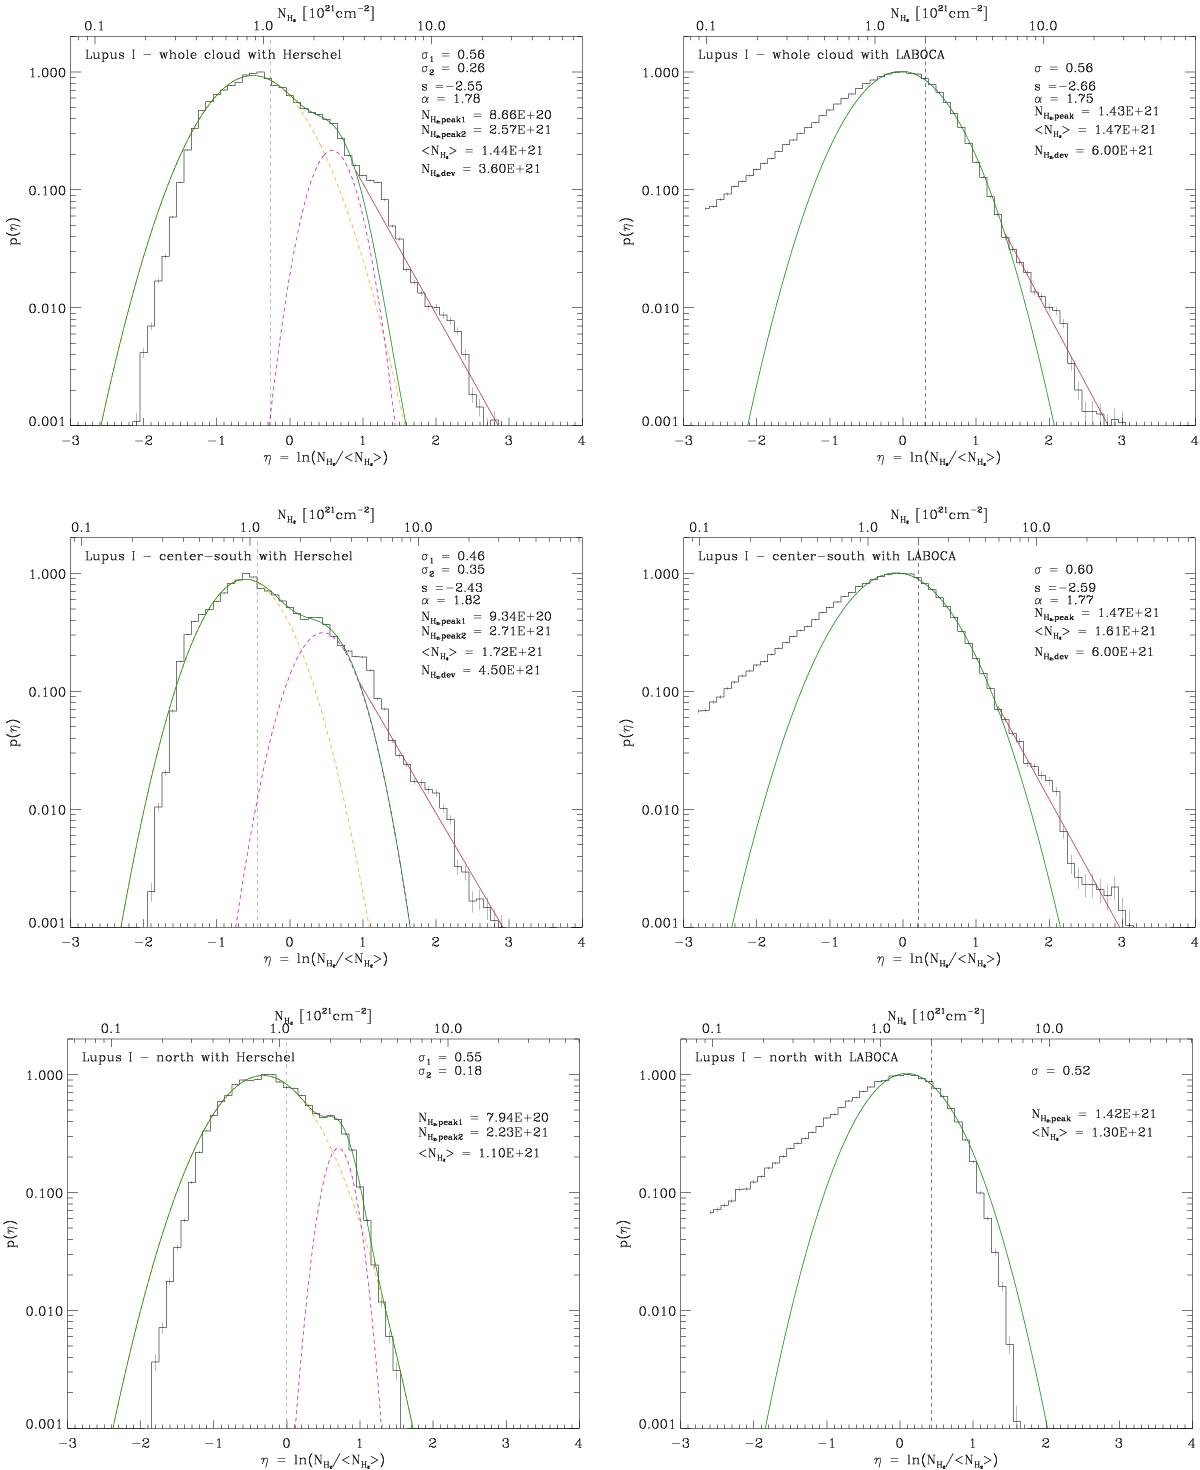
Column density PDFs of Lupus I and their model fits for the north and the center-south parts of the cloud, and for the entire cloud. The error bars show the ![]() uncertainties. In the case of Herschel the yellow and purple dashed lines show the fits of the two lognormals to the distribution around the first and second peak, respectively. Their superposition is represented by the solid green line. For LABOCA the solid green line shows the lognormal fit to the distribution around the peak. For all cases the straight solid red line shows the power-law fit to the high-density tail of the PDF, if applicable. In each plot we give the value of the dispersion(s) of the fitted lognormal(s) σi, the position(s) of the peak(s) of the lognormal(s) NH2,peaki, the slope of the fitted power-law tail s, the corresponding slope of an equivalent spherical density distribution α, the mean column density ⟨ NH2 ⟩, and the deviation point from the lognormal to the power-law tail NH2,dev. The vertical dashed line marks the incompleteness limit (lowest closed contour), which is 1.1 × 10²¹ and 2 × 1021 cm-2 for the Herschel and LABOCA map, respectively.
uncertainties. In the case of Herschel the yellow and purple dashed lines show the fits of the two lognormals to the distribution around the first and second peak, respectively. Their superposition is represented by the solid green line. For LABOCA the solid green line shows the lognormal fit to the distribution around the peak. For all cases the straight solid red line shows the power-law fit to the high-density tail of the PDF, if applicable. In each plot we give the value of the dispersion(s) of the fitted lognormal(s) σi, the position(s) of the peak(s) of the lognormal(s) NH2,peaki, the slope of the fitted power-law tail s, the corresponding slope of an equivalent spherical density distribution α, the mean column density ⟨ NH2 ⟩, and the deviation point from the lognormal to the power-law tail NH2,dev. The vertical dashed line marks the incompleteness limit (lowest closed contour), which is 1.1 × 10²¹ and 2 × 1021 cm-2 for the Herschel and LABOCA map, respectively.
Current usage metrics show cumulative count of Article Views (full-text article views including HTML views, PDF and ePub downloads, according to the available data) and Abstracts Views on Vision4Press platform.
Data correspond to usage on the plateform after 2015. The current usage metrics is available 48-96 hours after online publication and is updated daily on week days.
Initial download of the metrics may take a while.