Free Access
Fig. 4
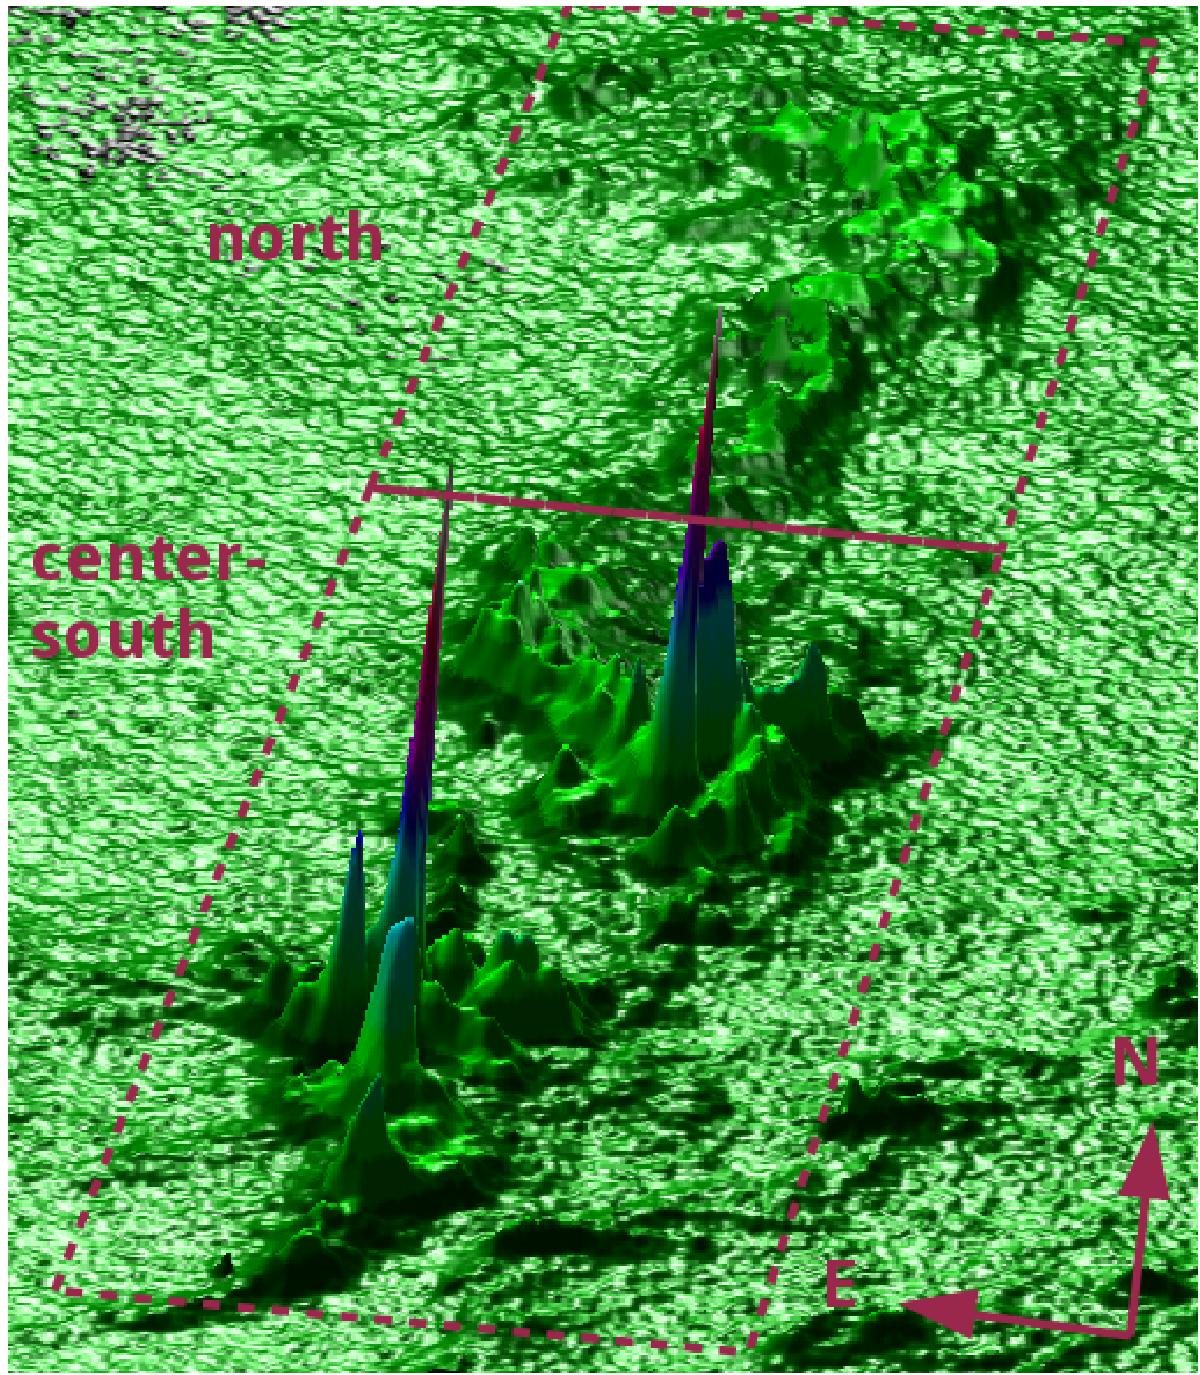
3D surface plot of the Herschel 250 μm column density map. The cores in the center-south of Lupus I can be identified and the average lower column density in the northern part of the cloud can be seen. The red dashed boxes mark the two regions that we distinguish in this work.
Current usage metrics show cumulative count of Article Views (full-text article views including HTML views, PDF and ePub downloads, according to the available data) and Abstracts Views on Vision4Press platform.
Data correspond to usage on the plateform after 2015. The current usage metrics is available 48-96 hours after online publication and is updated daily on week days.
Initial download of the metrics may take a while.