Fig. 1
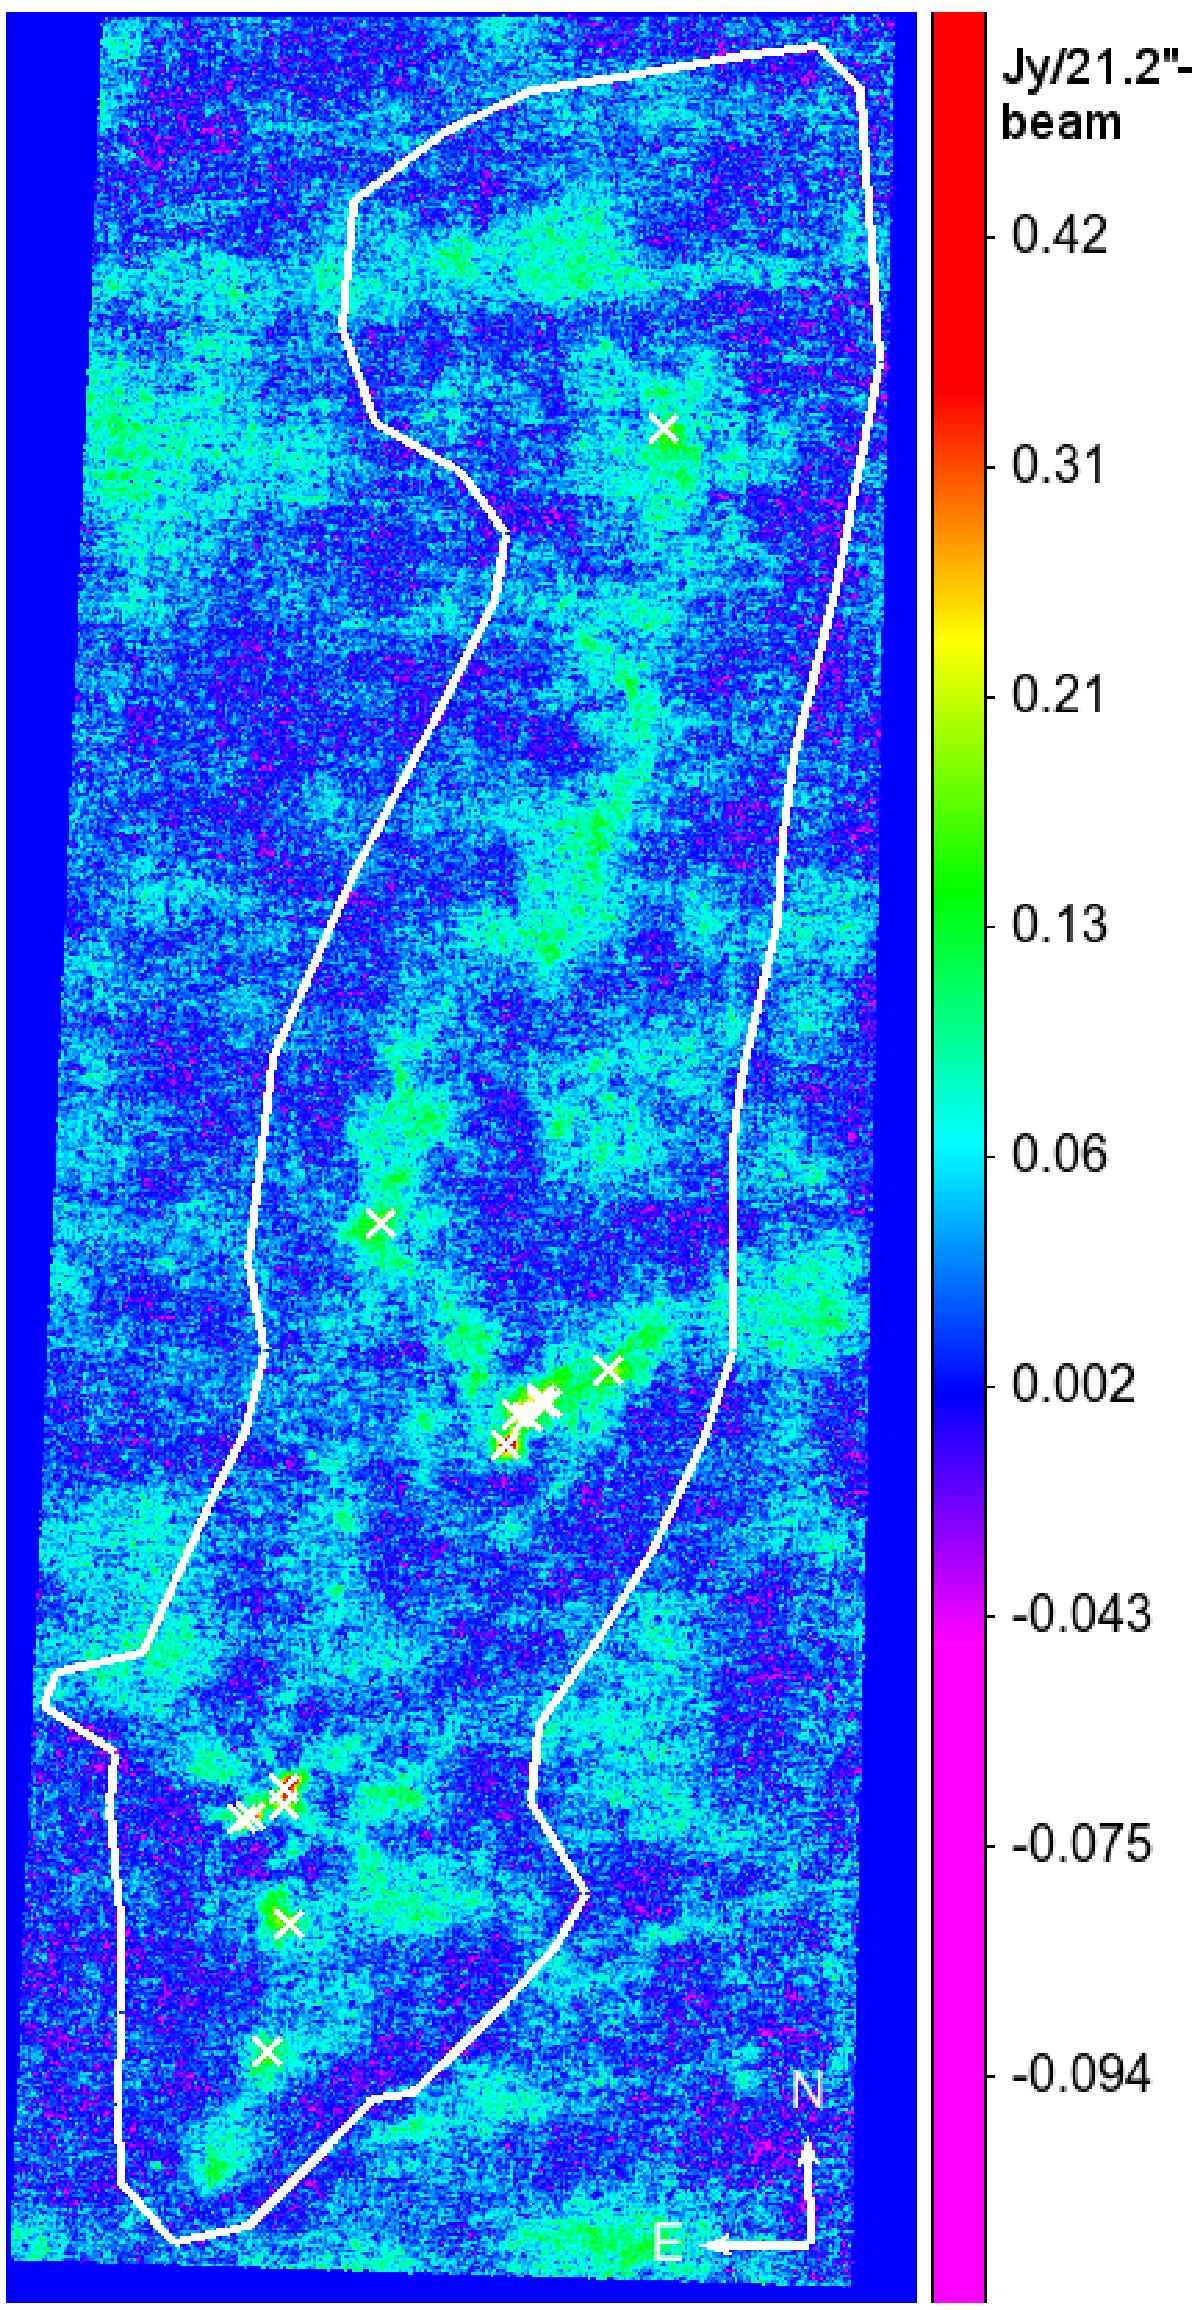
Lupus I LABOCA 870 μm map with square-root intensity scaling in units of Jy/21.2″-beam. The positions of the 15 cores that were found by Clumpfind are marked with white crosses. The white polygon indicates the common area within which the mass of the cloud was calculated from the LABOCA and Herschel column density maps (see Sect. 4.4).
Current usage metrics show cumulative count of Article Views (full-text article views including HTML views, PDF and ePub downloads, according to the available data) and Abstracts Views on Vision4Press platform.
Data correspond to usage on the plateform after 2015. The current usage metrics is available 48-96 hours after online publication and is updated daily on week days.
Initial download of the metrics may take a while.