| Issue |
A&A
Volume 584, December 2015
|
|
|---|---|---|
| Article Number | A98 | |
| Number of page(s) | 11 | |
| Section | Atomic, molecular, and nuclear data | |
| DOI | https://doi.org/10.1051/0004-6361/201526499 | |
| Published online | 27 November 2015 | |
Hydrogen isotope exchanges between water and methanol in interstellar ices
1
Univ. Grenoble Alpes, IPAG,
38000
Grenoble,
France
e-mail:
This email address is being protected from spambots. You need JavaScript enabled to view it.
2
CNRS, IPAG, 38000
Grenoble,
France
3
Aix-Marseille Université, PIIM UMR-CNRS 7345,
13397
Marseille,
France
Received: 8 May 2015
Accepted: 22 September 2015
Abstract
The deuterium fractionation of gas-phase molecules in hot cores is believed to reflect the composition of interstellar ices. The deuteration of methanol is a major puzzle, however, because the isotopologue ratio [CH2DOH]/[CH3OD], which is predicted to be equal to 3 by standard grain chemistry models, is much larger (~20) in low-mass hot corinos and significantly lower (~1) in high-mass hot cores. This dichotomy in methanol deuteration between low-mass and massive protostars is currently not understood. In this study, we report a simplified rate equation model of the deuterium chemistry occurring in the icy mantles of interstellar grains. We apply this model to the chemistry of hot corinos and hot cores, with IRAS 16293-2422 and the Orion KL Compact Ridge as prototypes, respectively. The chemistry is based on a statistical initial deuteration at low temperature followed by a warm-up phase during which thermal hydrogen/deuterium (H/D) exchanges occur between water and methanol. The exchange kinetics is incorporated using laboratory data. The [CH2DOH]/[CH3OD] ratio is found to scale inversely with the D/H ratio of water, owing to the H/D exchange equilibrium between the hydroxyl (-OH) functional groups of methanol and water. Our model is able to reproduce the observed [CH2DOH]/[CH3OD] ratios provided that the primitive fractionation of water ice [HDO]/[H2O] is ~2% in IRAS 16293-2422 and ~0.6% in Orion KL. We conclude that the molecular D/H ratios measured in hot cores may not be representative of the original mantles because molecules with exchangeable deuterium atoms can equilibrate with water ice during the warm-up phase.
Key words: astrochemistry / molecular processes / solid state: volatile / ISM: molecules
© ESO, 2015
1. Introduction
Primordial deuterium (D) was produced during the Big Bang nucleosynthesis with an abundance relative to hydrogen (H) of [D]/[H] primordial ~ 2.8 × 10⁻⁵ (Fumagalli et al. 2011). Since these “dark ages”, stellar nucleosynthesis has converted a significant fraction of D to 3He. The D/H ratio present in the protosolar nebula (PSN) 4.6 Gyr ago is thus estimated as [D]/[H] PSN ~ 2.1 × 10⁻⁵ (Geiss & Gloeckler 1998), while the current value in the local interstellar medium (ISM) is [D]/[H] local ~ 1.6 × 10⁻⁵ (Linsky 2007). Among all the elements, the two stable isotopes of hydrogen have the largest mass difference. The difference in zero-point energies between a deuterated molecule and its hydrogenated counterpart leads therefore to strong fractionation effects at low temperature. A number of interstellar molecules are thus observed with deuterium enhancements of several orders of magnitude, that is molecular D/H ratios up to a few 10-1 (see the recent review by Ceccarelli et al. 2014).
Of all the various deuterated interstellar molecules, methanol is an interesting species for several reasons. First, gas-phase methanol is ubiquitous and solid methanol is a major constituent of the ices coating the dust grains in the cold ISM. The fractional abundance of gaseous methanol (relative to H) is thus ~10-9 in cold clouds and ~10-6 in hot cores, where ices have sublimated. Second, methanol is one of the most deuterated interstellar molecules with, in particular, the triply deuterated isotopologue identified towards the low-mass protostar IRAS 16293-2422 with a fractionation ratio [CD3OH]/[CH3OH] ~ 0.01 (Parise et al. 2004). Third, the large abundances of methanol cannot be explained by gas-phase reactions (Garrod et al. 2006; Geppert et al. 2006). Among possible processes on the grain surfaces, the most efficient mechanism in molecular clouds, seems to be the stepwise hydrogenation of solid CO by the highly mobile H atoms (see Watanabe et al. 2007, and references therein). The deuteration of methanol can also proceed through the addition of atomic deuterium on CO, or alternatively via H/D substitution reactions on CH3OH, as demonstrated experimentally by Nagaoka et al. (2005, 2007). Observationally, the high deuterium enhancements observed for CH2DOH, CHD2OH, and CD3OH are consistent with the statistical addition of H and D atoms to CO, provided that the atomic [D]/[H] ratio in the gas-phase is ~0.1–0.2 during methanol formation (Parise et al. 2006). In this scenario, the deuteration of solid methanol simply scales with the gas-phase atomic [D]/[H] ratio. This latter is predicted to exceed 0.1 in regions with high density and heavy depletion, such as prestellar cores (Roberts et al. 2003).
Statistical models of CO hydrogenation, however, fail to explain the low abundance of CH3OD observed in low- and intermediate-mass protostars (Parise et al. 2006; Ratajczak et al. 2011). Indeed, the gas-phase abundance ratio [CH2DOH]/ [CH3OD] in these sources is found to be unexpectedly large (≳20) compared to the value of 3 predicted by grain chemistry models (e.g. Charnley et al. 1997; Osamura et al. 2004). Two main mechanisms have been suggested to explain this observational result. First, CH3OD could be selectively destroyed in the post-evaporative gas-phase chemistry through protonation reactions because the dissociative recombination (DR) of CH2DOH reforms CH2DOH, while the DR of CH3ODH+ can lead to both CH3OD and CH3OH (Osamura et al. 2004). Second, laboratory experiments have shown that H/D exchange reactions in solid state can produce a low CH3OD abundance. Thus, in the experiments of Nagaoka et al. (2005, 2007), H/D substitution reactions with atomic deuterium were shown to lead to the formation of methyl-deuterated methanol isotopologues, but no hydroxyl-deuterated isotopologues. Thermally activated H/D exchanges between water and methanol were also studied by Souda et al. (2003), using secondary ion mass spectrometry, and by Ratajczak et al. (2009), using Fourier-transform infrared (FTIR) spectroscopy. Rapid exchanges, within a few days or less, were found to start at 120 K in the experiment of Ratajczak et al. (2009) where CD3OD was co-deposited in an intimate mixture with amorphous solid water (ASW). H/D exchanges were found to proceed through hydrogen bonds in the hydroxyl functional groups of methanol, but not in the -CD3 methyl groups, depleting CD3OD and producing CD3OH and HDO. The role of ASW crystallization in promoting molecular mobility was also emphasized by Ratajczak et al. (2009). Following this work, Faure et al. (2015) have recently determined the corresponding kinetic orders and rate constants, for both the H/D exchange and crystallization processes, in the temperature range 120−135 K.
The above mechanisms can thus explain, at least qualitatively, a ratio [CH2DOH]/[CH3OD] much larger than 3, as observed in low- and intermediate-mass protostars. A major puzzle, however, is that the reverse behaviour is observed in high-mass protostars: the methanol isotopologue ratio is found to be lower than 3, [CH2DOH]/[CH3OD]~ 1, towards Orion KL (Jacq et al. 1993; Peng et al. 2012; Neill et al. 2013), W3(H2O) and possibly G24.78+0.08 (Ratajczak et al. 2011). The similar abundances of CH3OD and CH2DOH in these sources is currently not understood. A number of hypothesis have been suggested by several authors, but as yet none is really convincing. One possibility is that gas-phase chemistry in the hot core phase could alter the primitive fractionation ratio set in the ice mantles. However, in order to decrease the [CH2DOH]/[CH3OD] ratio from 3 to ~1, unrealistic high [HDO]/[H2O] ratios (≳0.1) are necessary (Charnley et al. 1997; Osamura et al. 2004). In addition, the chemical timescales required to modify the primitive fractionations are longer than the typical timescale of the hot core phase, which is at most a few 104 yr (Rodgers & Millar 1996). Processes in the ice offer an alternative, but a single mechanism should reconcile the different methanol isotopologue ratios in low- and high-mass sources. This mechanism has been elusive so far, which led several authors to suggest that an important piece of the puzzle is still missing (Ratajczak et al. 2011; Peng et al. 2012; Neill et al. 2013).
Yet there is a robust observational result: the deuterium enrichment of (gas-phase) organic molecules is larger in low mass than in massive protostars. The low- and high-mass sources for which deuterium fractionation has been best studied are IRAS 16293-2422 and Orion KL, respectively. Both sources were in particular the subject of recent multi-line studies of water and methanol, including deuterated isotopologues, using Herschel/HIFI (Coutens et al. 2012, 2013; Neill et al. 2013). In the Compact Ridge region within Orion KL, the fractionation ratio [CH2DOH]/[CH3OH] was found to be ~6 × 10⁻³ (Neill et al. 2013) while it is ~0.4 in IRAS 16293-2422 (Parise et al. 2006), that is about 70 times larger. In contrast, the [HDO]/[H2O] ratio is similar in both sources: it was estimated as ~4 × 10⁻³ in the Compact Ridge (Neill et al. 2013) and it lies in the range 10-3−5 × 10⁻² in the hot corino of IRAS 16293-2422 (Coutens et al. 2013; Persson et al. 2013, 2014). A ratio above a few 10-2 is however unlikely since the highest upper limit on the [HDO]/[H2O] ratio in the ice phase is ~2 × 10⁻² (Parise et al. 2003; Gálvez et al. 2011). As a result, the deuterium fractionation of the (methyl-deuterated) methanol appears to be much larger (a factor of 10 or more) than that of water in IRAS 16293-2422, while the deuteration is similar for water and methanol in Orion KL.
In this work, experimental kinetic data are employed in a simplified grain surface chemistry network involving all hydrogenated and deuterated isotopologues of water and methanol. A standard rate equation model is employed using, in particular, the kinetic rate constant measured by Faure et al. (2015) for H/D exchanges between methanol and water in ASW. The results are compared to observations towards the hot cores of IRAS 16293-2422 and the Orion Compact Ridge, focusing on the evolution of the [CH2DOH]/[CH3OD] and [HDO]/[H2O] ratios following the sublimation of the ice mantles. The model of deuterium chemistry is described in Sect. 2 and the results are presented in Sect. 3. In Sect. 4 we discuss the implications of our results and we conclude in Sect. 5.
2. Model
In the present work, a simplified grain surface chemistry network is developed using time-dependent rate equations. The code only deals with the hot core phase, when ices are thermally heated and sublimated, but the post-evaporative gas-phase chemistry is neglected. We thus assume that the hot core phase, which lasts ~104 yr, is too short for gas-phase chemistry to alter the deuterium fractionation ratios set in the ice (see Rodgers & Millar 1996). Only gas-grain interactions, i.e. thermal desorption and adsorption, and hydrogen isotope exchange reactions in the ice are considered. We adopt the formulation of Hasegawa et al. (1992) for the desorption and accretion rates, as explained below. Molecules are physisorbed onto standard dust grains, which are characterized by a radius of 0.1 μm, a density of 3 g cm-3 and 1.3 × 10⁶ surface sites for adsorption (i.e. one monolayer), corresponding to a surface density of sites ns = 1.0 × 1015 cm-2. With a gas-to-dust ratio of 100 by mass, the number density of the grains, nd, is 1.3 × 10⁻¹²nH, where nH is the total abundance of hydrogen atoms, i.e. nH = n(H) + 2n(H2). With the ice compositions given below, the total number of monolayers on a grain is ~30. In all calculations, we assume that the gas and dust temperatures, Tg and Td, are equal.
2.1. Thermal desorption and accretion
The desorption energies Ed of all species are that of water, taken from Sandford & Allamandola (1988). It is thus assumed that all species co-desorb with water, as found experimentally for CH3OH co-deposited in an intimate mixture with water (Collings et al. 2004). In addition, desorption follows a first-order kinetics, as presumed by Sandford & Allamandola (1988). In fact, many recent studies on the thermal desorption of thick multi-layer ices have shown that the desorption kinetics resemble zeroth-order rather than first order reaction kinetics (Fraser et al. 2001; Brown & Bolina 2007; Burke & Brown 2010). We have checked, however, that the half-lives of H2O ice derived from these studies (e.g. Brown & Bolina 2007) are in good agreement with that of Sandford & Allamandola (1988). The desorption rate was thus taken as  (1)with νdes = 2.0 × 10¹² s-1 and Ed = 5070 K for annealed ASW (Sandford & Allamandola 1988). At 100 K, this rate is ~1.9 × 10⁻¹⁰ s-1, corresponding to a half-life of 116 yr. This can be compared with the value of 67 yr deduced from the experimental data of Brown & Bolina (2007). Desorption by cosmic rays and photodesorption are neglected in our model.
The sticking coefficient for all species striking a grain is assumed to be 1.0 (see e.g. Gibson et al. 2011, for H2O sticking on H2O ice). The accretion rate for a given molecule i is therefore (Hasegawa et al. 1992):  (2)where σd is the geometrical dust-grain cross section and ⟨ v(i) ⟩ is the thermal velocity of molecule i. At 100 K and for nH = 2 × 107 cm-3, this rate is ~2.8 × 10⁻¹⁰ s-1 for H2O. Grains are neutral in our model.
2.2. Hydrogen isotope exchanges
In contrast to usual grain chemistry models, here the adsorbed species do not require large scale mobility to react. This is, first, because the reactant H2O is in large excess and, as a result, each deuterated methanol molecule is always surrounded by four H2O molecules. Second, H/D exchanges only require protons and deuterons to be labile in the ice. We therefore do not need to include the diffusion of molecular species via thermal hopping or quantum tunnelling in the rate equations. On the other hand, the lability of protons and deuterons, as well as the mobility of water molecules triggerred by ASW crystallization, is included through the experimental H/D exchange rate constant.
The experiment of Ratajczak et al. (2009) had demonstrated that H/D exchanges between methanol and water occur in the hydroxyl functional group of methanol, but not in the methyl group. In the study of Faure et al. (2015), the kinetics of the following reaction was thus measured:  (3)by monitoring the time evolution of HDO with FTIR spectroscopy. The rate constant for the forwards direction was shown to follow a simple Arrhenius law over the temperature range 120–135 K,
  (4)with νexch = 9.7 × 10⁹ s-1 and Eexch = 4100 K if a first-order kinetics is assumed. The uncertainty on the activation energy Eexch is about 900 K, which translate into three orders of magnitude uncertainties in the pre-exponential factor νexch (Faure et al. 2015). It is therefore crucial to adopt the previous numerical values of νexch and Eexch as a kinetic doublet. In fact, the experimental data of Faure et al. (2015) are best reproduced by a second- or third-order kinetic model. A first-order approximation is adopted here for simplicity, but with the corresponding kinetic doublet. Finally, it should be noted that kexch is an apparent or pseudo first-order rate constant since in the experiment H2O was in great excess compared to CD3OD and thus kexch does not depend on the order of the reaction with respect to H2O (i.e. the partial order of H2O). At 100 K, the above pseudo first-order rate is ~1.5 × 10⁻⁸ s-1, corresponding to a half-life of 1.5 yr. This timescale is thus significantly shorter than the timescales for thermal desorption and accretion.
In the standard rate equations described below, the reaction flux Ri;j, in cm-3 s-1, between two adsorbed species i and j is expressed in terms of a rate constant ki;j, in cm3 s-1, analoguous to those employed in gas-phase two-body reactions  (5)where ns(i) is the surface abundance of species i. The above first-order rate constant kexch is thus related to the second-order rate constant kCD3OD;H2O via the expression
  (6)assuming a H2O partial order of 1. The two-body rate constant for H/D exchanges between CD3OD and H2O is, therefore,
  (7)Thus, the reaction rate “constant” for H/D exchanges vary with time depending on the surface abundance of H2O. This variation is however weak in practice (about 40% at 100 K) and it is mainly caused by sublimation. This treatment is analoguous to that of the grain surface formation of H2 in gas-phase networks where the rate constant depends on the gas-phase abundance of hydrogen atoms.
As a consequence of the above treatment, the exchange rate constants ki;j were set to zero in two circumstances: i) if the abundance of a solid reactant is below that of grains (unphysical); and ii) if the number of monolayers is lower than one. This latter condition was however found to occur only for grain temperatures above 110 K.
2.3. Reversibility
H/D exchange reactions are almost thermoneutral and they are reversible in the ice (Collier et al. 1984). This is exemplified in the chemical Eq. (3) above. In the experiment of Faure et al. (2015), only the forwards reaction rate constant was measured but microscopic reversibility predicts a relationship between the forwards kf and backwards kb rate constants: their ratio, kf/kb, should be equal to K(T), the equilibrium constant. In the theory for gaseous molecules, this constant depends on the masses and partition functions of the reactants and products, and on the difference between their zero-point vibrational energies (e.g. Richet et al. 1977). A simplified expression for K(T) in liquid solutions is (Bertrand & Burchfield 1975; Fenby & Bertrand 1982) as follows:  (8)where ΔH is the effective enthalpy of the reaction and Kstat is the (high temperature) statistical equilibrium constant based on a completely random distribution of exchangeable (identical) particles such as protons and deuterons. We stress that this equation requires that the (standard) entropy of reaction is equal to ln(Kstat) at all temperature.
In the case of the prototypical H/D exchange reaction  (9)it can be easily shown that Kstat = 4. The enthalpy ΔH is unknown in the ice phase, but the equilibrium constant has been measured in the liquid and gas phase. Although there is some variation in published values, a reference experimental value for the liquid phase is K(298 K) = 3.82 (Simonson 1990), which compares well with the gas-phase theoretical value1K(300 K) = 3.83. This equilibrium constant K(298 K) = 3.82 corresponds to an effective enthalpy ΔH = 14 K, which is employed below.
Similarly, in the case of the reaction  (10)one can show that Kstat = 2. The equilibrium constant for this reaction was also measured in liquid phase by several authors (see Zhang & Martin 1992, and references therein). Values at 298 K are dispersed in the range 1.4−2 and we have thus adopted ΔH = 50 K in the following.
We stress that the notion of reversibility may seem contradictory with the irreversible behaviour of the crystallization process, which promotes H/D exchanges. As discussed in Faure et al. (2015), however, H/D exchanges occur in the very initial phase of crystallization, during the nucleation process. The reversibility of H/D exchanges is thus consistent with the idea that amorphous water ice melts into a metastable liquid-like state prior to crystallizing (the glass transition), as suggested experimentally (see e.g. Smith & Kay 1999). In other words, crystallization is not expected to prevent exchanges to reach equilibrium.
In addition to reaction (10), seven other reversible reactions between the hydroxyl-deuterated isotopologues of methanol and water are considered: ![Mathematical equation: \begin{eqnarray} && \rm CH_2DOD + H_2O \rightleftharpoons CH_2DOH + HDO, \\[2.5mm] && \rm CHD_2OD + H_2O \rightleftharpoons CHD_2OH + HDO, \\[2.5mm] \label{reac4} && \rm CD_3OD + H_2O \rightleftharpoons CD_3OH + HDO, \\[2.5mm] \label{reac5} && \rm CH_3OD + HDO \rightleftharpoons CH_3OH + D_2O, \\[2.5mm] && \rm CH_2DOD + HDO \rightleftharpoons CH_2DOH + D_2O, \\[2.5mm] && \rm CHD_2OD + HDO \rightleftharpoons CHD_2OH + D_2O, \\[2.5mm] \label{reac6} && \rm CD_3OD + HDO \rightleftharpoons CD_3OH + D_2O. \end{eqnarray}](/articles/aa/full_html/2015/12/aa26499-15/aa26499-15-eq78.png) Reactions (10)–(13) all proceed with the forwards second-order rate constant
Reactions (10)–(13) all proceed with the forwards second-order rate constant  (18)as deduced from Eqs. (4)–(7), and the backwards (second-order) rate constant
  (19)as deduced from the measurements in liquid water (Bertrand & Burchfield 1975; Zhang & Martin 1992). We thus assume that all reactions (10)–(13) have the same enthalpy ΔH = 50 K. Similarly, reactions (14)–(17) proceed with a forwards rate constant
  (20)and a backwards rate constant
  (21)Here we assume that H/D exchanges with HDO (which are of secondary importance in our network because of the predominance of H2O) proceed with the same (first-order) forwards rate constant as with H2O. The enthalpy of these reactions is taken as ΔH = 36 K, which is the enthalpy difference between reaction (10) and reaction (9). Indeed, in case of multiple equilibria, the principle of addition of enthalpies (Hess’s law) allows us to calculate unknown enthalpy change from the combination of reactions.
The last reversible reaction is given by Eq. (9) for which the forwards rate constant is taken as in Eq. (18) and the backwards rate constant as  (22)It is thus assumed that H/D exchanges in D2O + H2O proceed with the same rate constant as in CH3OD + H2O. This hypothesis is consistent with a number of measurements in water ice (Park et al. 2010; Lamberts et al. 2015). In particular, the very recent FTIR experiment of Lamberts et al. (2015) on reaction (9) in ASW and for temperatures in the 90–140 K domain, has provided an activation energy of 3840 ± 125 K, which is in good agreement with the value of 4100 ± 900 K determined by Faure et al. (2015) for reaction (3). Reaction (9) was also studied in the range 135–150 K in cubic ice by Collier et al. (1984), who found an activation energy of ~4800 K. In the study of Collier et al. (1984), the H/D exchange mechanism was separated into a two-step reaction sequence, the so-called hop-and-turn mechanism. This study was extended to ASW samples in the 108 to 125 K domain by Fisher & Devlin (1995) and a significantly lower activation energy of ~3000 K was measured. However, protons were injected into the ASW samples in this case. Finally, Park et al. (2004) have also measured H/D exchanges between water molecule at ice surfaces and they obtained a rate of ~6 × 10⁻⁴ s-1 at 140 K in rather good agreement with the value of 2 × 10⁻³ s-1 obtained from Eq. (4) above. However, as a result of the very low abundance of D2O with respect to HDO and CH3OD in our model, the reaction between D2O and H2O is of minor importance in our methanol network.
Finally, we emphasize that the kinetic parameters of Eq. (4) were derived experimentally by Faure et al. (2015) over the limited temperature range 120–135 K. They are expected to apply over a much larger range of temperatures, although deviations from the Arrhenius behaviour are likely at very low temperatures due to quantum effects (e.g. Mispelaer et al. 2012).
2.4. Surface reaction network
The ice-phase species considered above are coupled to the gas phase through the accretion and thermal sublimation processes. The rate equations for a species i in the ice phase with concentration ns(i) and in the gas phase with concentration n(i) are given by the following expressions: ![Mathematical equation: \begin{eqnarray} {\rm d}n_{\rm s}(i)/{\rm d}t & = & \sum_l\sum_j k_{l; j}n_{\rm s}(l)n_{\rm s}(j) - n_{\rm s}(i)\sum_j k_{i; j}n_{\rm s}(j) \nonumber \\[2mm] & & + n(i)k_{\rm acc}(i) - k_{\rm evap}n_{\rm s}(i), \label{tsurf} \\[2mm] {\rm d}n(i)/{\rm d}t & = & -n(i)k_{\rm acc}(i) + k_{\rm evap}n_{\rm s}(i). \label{tgas} \end{eqnarray}](/articles/aa/full_html/2015/12/aa26499-15/aa26499-15-eq91.png) The above equations are identical to standard gas-grain chemical models (e.g. Hasegawa et al. 1992) except that i) diffusion of adsorbed species is not needed and therefore purposely not included in Eq. (23); and ii) gas-phase reactions are ignored in Eq. (24). Chemical reactions are thus restricted to H/D exchanges in the solid phase through the rate constants ki;j defined in Eqs. (18)–(22).
The above equations are identical to standard gas-grain chemical models (e.g. Hasegawa et al. 1992) except that i) diffusion of adsorbed species is not needed and therefore purposely not included in Eq. (23); and ii) gas-phase reactions are ignored in Eq. (24). Chemical reactions are thus restricted to H/D exchanges in the solid phase through the rate constants ki;j defined in Eqs. (18)–(22).
The numerical method employed to solve the previous coupled differential equations is adapted to stiff ordinary differential equations (ODE) systems, as implemented in the LSODE solver from the ODEPACK package (Hindmarsh 1983). Abundances are followed up to steady-state, which occurs within ~103 yr at a density of nH = 2 × 107 cm-3 and T=100 K. There are nine reversible surface reactions in our network, Eq. (9)–(17), involving eleven species listed in Tables 1, 2 below.
Initial conditions for the ice composition in IRAS 16293-2422.
Initial conditions for the ice composition in Orion KL.
2.5. Initial conditions
The chemical model was run for two different initial conditions, representative of the ice composition measured towards low-mass and massive protostars. The initial ice-phase abundances were thus taken as the median ice composition determined by Öberg et al. (2011): the methanol abundance (by number) relative to water is 3% towards low-mass protostars and 4% towards high-mass protostars. A mean H2O ice abundance of 5 × 10⁻⁵nH, i.e. 10-4n(H2), is assumed for both low- and high-mass sources (Öberg et al. 2011). The initial fractionation ratios were computed using a purely statistical model. Thus, if pD is the probability of accretion of D atoms on a grain, the statistical fractionation ratio of HDO (R(HDO) ≡ [HDO]/[H2O]) is  (25)where αw is the accreting D/H ratio during the formation of water,
 ![Mathematical equation: \hbox{$\alpha_{\rm w}=[\rm D]/[\rm H]/\!\sqrt{2}$}](/articles/aa/full_html/2015/12/aa26499-15/aa26499-15-eq112.png) . The
. The  arises because the accretion of an atom is inversely proportional to the square root of its mass (assuming the sticking coefficient is identical for H and D). Similarly, for D2O, we find
  (26)As discussed below, the accreting D/H ratio can vary with time and we have therefore assumed that methanol can form with an accreting D/H ratio αm different from that of water. We find therefore for the isotopologues of methanol as follows:
![Mathematical equation: \begin{eqnarray} \label{stat3} && R({\rm CH_3OD}) = \alpha_{\rm m} ,\\[2mm] \label{stat4} && R({\rm CH_2DOH}) = 3\alpha_{\rm m} ,\\[2mm] && R({\rm CH_2DOD}) = 3\alpha_{\rm m}^2 ,\\[2mm] && R({\rm CD_2HOH}) = 3\alpha_{\rm m}^2 ,\\[2mm] && R({\rm CD_2HOD}) = 3\alpha_{\rm m}^3 ,\\[2mm] && R({\rm CD_3OH}) = \alpha_{\rm m}^3 ,\\[2mm] \label{stat9} && R({\rm CD_3OD}) = \alpha_{\rm m}^4. \end{eqnarray}](/articles/aa/full_html/2015/12/aa26499-15/aa26499-15-eq115.png) The αw and αm ratios cannot be directly measured in the interstellar gas. The αm ratio can, however, be inferred from the measured D/H ratios of gaseous methanol, assuming that the initial (statistical) deuteration of CH2DOH in the ice is conserved during the heating and hot core phase (Ratajczak et al. 2009; Faure et al. 2015). In this hypothesis, the observed fractionation ratio R(CH2DOH) can serve as a proxy of αm. As discussed in the Introduction, the best studied low- and high-mass protostars are IRAS 16293-2422 and Orion KL, respectively. In IRAS 16293-2422, the gas-phase R(CH2DOH) ratio was found to be ~0.37 (Parise et al. 2006)2. In the Orion Compact Ridge, this ratio is ~5.8 × 10⁻³ (Neill et al. 2013). From Eq. (28), these values correspond to αm ratios of ~0.12 and ~2 × 10⁻³. These values were employed in Eqs. (27)–(33) to specify the initial conditions listed in Table 1 for IRAS-16293-2422 and in Table 2 for the Compact Ridge. The different values of αm in low- and high-mass protostars are discussed in Section 4. In the case of water, Eqs. (25), (26) were used but a large range of αw values between 10-5 and 5 × 10⁻² was adopted, based on the observational constraints. The D/H ratio of water ice is thus employed as a free parameter in our model, in agreement with the hypothesis that the deuterium fractionation ratios of solid water and methanol can be different.
The αw and αm ratios cannot be directly measured in the interstellar gas. The αm ratio can, however, be inferred from the measured D/H ratios of gaseous methanol, assuming that the initial (statistical) deuteration of CH2DOH in the ice is conserved during the heating and hot core phase (Ratajczak et al. 2009; Faure et al. 2015). In this hypothesis, the observed fractionation ratio R(CH2DOH) can serve as a proxy of αm. As discussed in the Introduction, the best studied low- and high-mass protostars are IRAS 16293-2422 and Orion KL, respectively. In IRAS 16293-2422, the gas-phase R(CH2DOH) ratio was found to be ~0.37 (Parise et al. 2006)2. In the Orion Compact Ridge, this ratio is ~5.8 × 10⁻³ (Neill et al. 2013). From Eq. (28), these values correspond to αm ratios of ~0.12 and ~2 × 10⁻³. These values were employed in Eqs. (27)–(33) to specify the initial conditions listed in Table 1 for IRAS-16293-2422 and in Table 2 for the Compact Ridge. The different values of αm in low- and high-mass protostars are discussed in Section 4. In the case of water, Eqs. (25), (26) were used but a large range of αw values between 10-5 and 5 × 10⁻² was adopted, based on the observational constraints. The D/H ratio of water ice is thus employed as a free parameter in our model, in agreement with the hypothesis that the deuterium fractionation ratios of solid water and methanol can be different.
Finally, elaborate theoretical models of the grain surface chemistry of deuterium exist in the literature (e.g. Charnley et al. 1997; Cazaux et al. 2011; Sipilä et al. 2013; Taquet et al. 2014; Lee & Bergin 2015). These are partly based on laboratory data, which may suggest deviations from statistical distributions in some cases. Modelling the deuterium fractionation processes of ices is clearly beyond the scope of the present paper, which intentionally focuses on a unique surface chemistry process, the deuteron scrambling in water ice.
3. Results
The coupled set of rate Eqs. (23), (24) was solved subject to the initial conditions listed in Tables 1 and 2 for IRAS 16293-2422 and the Orion Compact Ridge, respectively. The density was fixed at nH = 2 × 107 cm-3 for both sources, which is typical of hot core regions. The (equal) gas and dust temperatures, Tg and Td, were varied between 60 and 140 K, assuming an instantaneous temperature jump. For grain temperatures above 90 K, the steady-state was reached in less than 103 yr, which is shorter than the duration of the hot core phase. Only the steady-state solutions are therefore discussed in the following.
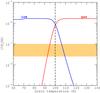 |
Fig. 1 Gas phase and ice abundance of CH3OH as a function of grain temperature. The abundance observed towards IRAS 16293-2422 is represented by the orange hatched zone (Parise et al. 2004). The solid vertical dashed line denotes the standard hot-core dust temperature Td = 100 K. See text for details. |
3.1. Low-mass protostar: IRAS 16293-2422
The steady-state gas- and ice-phase abundances of CH3OH in IRAS 16293-2422 are plotted in Fig. 1 as a function of dust temperature. In this plot, the initial solid water fractionation ratio is taken as [s-HDO]/[s-H2O] = 1%. We can observe that for temperatures lower than 85 K, the gas-phase abundance of CH3OH (relative to nH) is almost negligible, i.e. below 10-9. However, above this critical temperature, the abundance increases sharply and solid methanol is entirely sublimated for temperatures higher than 110 K. We find the high temperature gas-phase abundance (1.6 × 10⁻⁶) is slightly larger than the low-temperature ice-phase abundance (1.5 × 10⁻⁶). As we show below, this difference is caused by the H/D exchange reaction between methanol and water.
The CH3OH abundance (relative to nH) in IRAS 16293-2422 was estimated as ~5 × 10⁻⁸ using a CH3OH column density of ~1016 cm-2, as derived by Parise et al. (2004), and a H2 column density of ~1023 cm-2 for the hot corino of IRAS 16293-2422 (Chandler et al. 2005). The orange hatched zone in Fig. 1 depicts the corresponding uncertainty of a factor of 2. It is found from Fig. 1 that the observed abundance is consistent with a dust temperature of ~95 K. Hence, only a small fraction of the ice mantles seem to have evaporated into the gas phase (assuming that the ice composition in IRAS 16293-2422 is typical of low-mass sources). We recall, however, that in addition to an instantaneous temperature jump our model assumes single-size and single-temperature dust grains. If grains with different sizes have different temperatures, then ice mantles could be only partially released into the gas phase because of the grain temperature distribution (see e.g. Maret et al. 2005). In the following, we therefore employ a standard hot-core temperature Td = 100 K. This choice implies that warm (Td ≥ 100 K) mantles represent only a few percent of the total ice reservoir in IRAS 16293-2422. We have also checked that our conclusions are unchanged when using Td = 95 K.
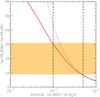 |
Fig. 2 Gas-phase abundance ratio of the singly deuterated isotopologues of methanol, [g-CH2DOH]/[g-CH3OD], as function of the initial water ice deuteration. The dust temperature is taken as 100 K. The dotted line corresponds to Eq. (36). The ratio observed towards IRAS 16293-2422 is represented by the orange hatched zone (Parise et al. 2004). |
The gas-phase isotopologue ratio [g-CH2DOH]/[g-CH3OD] obtained with our model is plotted in Fig. 2 as function of the free parameter, the initial water ice deuteration [s-HDO]/ [s-H2O]. The ratio is found to exceed the statistical value of 3 over the entire range of initial water deuteration. Isotopic H/D exchanges between methanol and water at ~100 K can thus quantitatively explain the large [g-CH2DOH]/[g-CH3OD] ratios observed in low-mass protostars. In particular, our model matches the observational ratio towards IRAS 16293-2422 (20 ± 11) for an initial [s-HDO]/[s-H2O] in the range ~1−5 × 10⁻². This range of values is consistent with the observational upper limits derived towards low-mass protostars, i.e. [s-HDO]/[s-H2O] ≤2 × 10⁻² (Parise et al. 2003; Gálvez et al. 2011), and with the most recent theoretical works, i.e. [s-HDO]/[s-H2O] ≤5 × 10⁻² (Lee & Bergin 2015). The observation of the two singly deuterated forms of methanol in the gas-phase thus provides an indirect measurement of the primitive deuteration of water, which has sublimated in the hot corino region. The large difference between this primitive D/H ratio ([s-HDO]/[s-H2O] ~2%) and that of methanol ([s-CH2DOH]/[s-CH3OH] = 36%, see Table 1) implies a strong heterogeneity of the molecular D/H enrichments in the grain mantles. This is further discussed in the next section.
We can now try to understand the above result analytically. The increase of the [g-CH2DOH]/[g-CH3OD] ratio with decreasing water deuteration was in fact expected since the amount of gaseous CH3OD should scale with [s-HDO]/[s-H2O]. Indeed, since the timescale for isotopic exchanges at 100 K is short compared to the desorption and accretion timescales (see Sects. 2.1 and 2.2), all H/D exchange reactions (9)–(17) attain equilibrium in the ice. In the case of the dominant process, Eq. (10), we can write at steady-state and at chemical equilibrium ![Mathematical equation: \begin{equation} \frac{[{\rm CH_3OH}][{\rm HDO]}}{[{\rm CH_3OD}][{\rm H_2O}]}=\frac{k_{\rm f}}{k_{\rm b}}=2\exp(-50/T_{\rm d}) \label{equi} . \end{equation}](/articles/aa/full_html/2015/12/aa26499-15/aa26499-15-eq135.png) (34)The above equation holds for both the ice and the gas phase, since the desorption rate is taken equal for all species. This was checked and confirmed numerically. As the initial abundance of CH2DOH is conserved in the ice (since no H/D exchange occur on the methyl group), we can combine Eqs. (28) and (34) and we obtain
(34)The above equation holds for both the ice and the gas phase, since the desorption rate is taken equal for all species. This was checked and confirmed numerically. As the initial abundance of CH2DOH is conserved in the ice (since no H/D exchange occur on the methyl group), we can combine Eqs. (28) and (34) and we obtain ![Mathematical equation: \begin{equation} \frac{[{\rm CH_2DOH}]}{[{\rm CH_3OD}]}=3\alpha_{\rm m}\times 2\exp(-50/T_{\rm d})\frac{[{\rm H_2O}]}{[{\rm HDO}]}\cdot \label{equi2} \end{equation}](/articles/aa/full_html/2015/12/aa26499-15/aa26499-15-eq136.png) (35)For a dust temperature Td = 100 K and αm = 0.12, we finally get
(35)For a dust temperature Td = 100 K and αm = 0.12, we finally get ![Mathematical equation: \begin{equation} \frac{[{\rm CH_2DOH}]}{[{\rm CH_3OD}]}=\frac{0.44}{[{\rm HDO}]/[{\rm H_2O}]}\cdot \label{equi3} \end{equation}](/articles/aa/full_html/2015/12/aa26499-15/aa26499-15-eq138.png) (36)Equation (36) is plotted in Fig. 2 as a dotted line. We can observe that it reproduces very well the ratio [g-CH2DOH]/[g-CH3OD] for initial water deuteration larger than ~5 × 10⁻². In this regime, the main reservoir of exchangeable deuterium atoms in the ice is water ([s-HDO] >2.5 × 10⁻⁶) and the HDO abundance is not modified by H/D exchanges with methanol since the (initial) CH3OD abundance is only 1.8 × 10⁻⁷. In contrast, at lower initial water deuteration, i.e. [s-HDO]/[s-H2O] ≲5 × 10⁻², the relative amount of deuterium atoms in CH3OD becomes significant. In this regime, water gets enriched in deuterium through H/D exchanges with CH3OD and the model deviates from Eq. (36) since the solid HDO abundance has increased.
(36)Equation (36) is plotted in Fig. 2 as a dotted line. We can observe that it reproduces very well the ratio [g-CH2DOH]/[g-CH3OD] for initial water deuteration larger than ~5 × 10⁻². In this regime, the main reservoir of exchangeable deuterium atoms in the ice is water ([s-HDO] >2.5 × 10⁻⁶) and the HDO abundance is not modified by H/D exchanges with methanol since the (initial) CH3OD abundance is only 1.8 × 10⁻⁷. In contrast, at lower initial water deuteration, i.e. [s-HDO]/[s-H2O] ≲5 × 10⁻², the relative amount of deuterium atoms in CH3OD becomes significant. In this regime, water gets enriched in deuterium through H/D exchanges with CH3OD and the model deviates from Eq. (36) since the solid HDO abundance has increased.
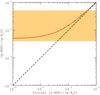 |
Fig. 3 Gas-phase deuterium fractionation of water, [g-HDO]/[g-H2O], as function of the initial water ice deuteration. The ratio observed towards IRAS 16293-2422 is represented by the orange hatched zone (Coutens et al. 2013). |
In order to illustrate this last point, in Fig. 3 we plotted the D/H ratio of gaseous water as function of the initial D/H ratio of water ice. If the D/H ratio of water ice was conserved during the sublimation process, i.e. if there was no H/D exchange, then the curve would follow the y = x function represented by the dashed line. As expected, however, when the initial [s-HDO]/ [s-H2O] is lower than ~5 × 10⁻², the gas-phase ratio is systematically increased with respect to the initial ice-phase value, by up to a factor of 50 at [s-HDO]/[s-H2O] = 10-4. For the best value [s-HDO]/[s-H2O] = 2% (see Fig. 2), the [g-HDO]/[g-H2O] values is found to be 2.5 × 10⁻². As shown in Fig. 3, this is consistent with the range of observational ratios [g-HDO]/[g-H2O] measured in the hot corino of IRAS 16293 by Coutens et al. (2013). We emphasize that observational uncertainties are large owing to optical thickness problems. In any case, if the post-evaporative chemistry has no significant effect on the deuterium and water chemistry, as assumed here, our model then predicts a D/H ratio for gaseous water of ~2.5% in the hot corino of IRAS 16293-2422. This value is in good agreement with the best-fit value of 1.8% derived by Coutens et al. (2013) from their multi-line analysis. On the other hand, if the low value of 9.2 ± 2.6 × 10⁻⁴ derived from the interferometric observations of Persson et al. (2013) is confirmed, then our model suggests that a significant additional production of gaseous H2O must occur during the (short) hot core phase.
Finally, in Table 3, we summarize the results of our best model, corresponding to an initial [s-HDO]/[s-H2O] of 2%. A good agreement with the observations is obtained, including the multiply deuterated isotopologues. The next isotopologue to be discovered is obviously CH2DOD, for which our model predicts a column density of ~1.2 × 1015 cm-2 or an abundance (relative to nH) of 5.8 × 10⁻⁹. To the best of our knowledge, however, experimental frequencies in the millimetre range are not available for this isotopologue. We can also notice that the fractionation ratio of D2O predicted by our model (1.7 × 10⁻⁴) agrees within a factor of ~2 with the best-fit value of 7 × 10⁻⁵ derived by Coutens et al. (2013) The value quoted in Table 3 is the upper limit at 3σ.
Comparison between observational fractionation ratios in the IRAS 16293-2422 hot corino source and our best model.
3.2. High-mass protostar: Orion Compact Ridge
The steady-state gas- and ice-phase abundances (relative to nH) of CH3OH in the Compact Ridge are plotted in Fig. 4 as a function of dust temperature. In this plot, the initial water fractionation ratio is again taken as [s-HDO]/[s-H2O] = 1%. As observed previously, the CH3OH abundance increases sharply above 90 K and solid methanol is entirely sublimated for temperatures higher than 110 K. The CH3OH abundance in the Compact Ridge is estimated as ~7.5 × 10⁻⁷, with a column density of 6.0 × 1017 cm-2 (Neill et al. 2013). The orange hatched zone in Fig. 4 depicts the corresponding uncertainty of a factor of 2. It is found that the observed abundance is consistent with a dust temperature of ~100 K. Thus, in contrast to IRAS 16293-2422, our model suggests that a large fraction (≳40%) of the ice mantles has evaporated in the compact ridge (assuming that the ice composition in the Compact Ridge is typical of high-mass sources). In the following, a standard hot-core dust temperature of 100 K is employed.
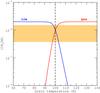 |
Fig. 4 Gas phase and ice abundance of CH3OH as a function of grain temperature. The abundance towards Orion KL is represented by the orange hatched zone (Neill et al. 2013). The solid vertical dashed line denotes Td = 100 K. See text for details. |
The gas-phase ratio [g-CH2DOH]/[g-CH3OD] obtained with our model is plotted in Fig. 5 as function of the initial water ice deuteration [s-HDO]/[s-H2O]. It is found to be below the statistical value of 3, as soon as the initial water deuteration is larger than ~3 × 10⁻³. Thus, isotopic H/D exchanges between methanol and water can also quantitatively explain the small [g-CH2DOH]/[g-CH3OD] ratios observed in high-mass protostars. In particular, our model matches the observational ratio towards the Compact Ridge (~1.2 ± 0.3) for an initial [s-HDO]/[s-H2O] in the range 5−8 × 10⁻³. Again, the determined range of D/H ratios for water ice is consistent with the upper limits derived towards high-mass protostars, i.e. [s-HDO]/[s-H2O] <10-2 (Dartois et al. 2003). In contrast to IRAS 16293-2422, the deduced primitive D/H ratio of water ice ([s-HDO]/[s-H2O] ~0.6%) is similar to that of methanol (see Table 2)in that it corresponds to a statistical deuteration with an accreting D/H atomic ratio αm ~ αw ~ 2−3 × 10⁻³.
As above, we can employ Eq. (35) for a dust temperature Td = 100 K and αm = 2 × 10⁻³, i.e. ![Mathematical equation: \begin{equation} \frac{[{\rm CH_2DOH}]}{[{\rm CH_3OD}]}=\frac{0.0073}{[{\rm HDO}]/[{\rm H_2O}]}\cdot \label{equi4} \end{equation}](/articles/aa/full_html/2015/12/aa26499-15/aa26499-15-eq168.png) (37)Equation (37), plotted in Fig. 5 as a dotted line, reproduces very well the ratio [g-CH2DOH]/[g-CH3OD] for all initial water deuterations over the range 10-3−10-1. Indeed, in this case the dominant reservoir of exchangeable deuterium atoms in the ice is always water ([HDO] >5 × 10⁻⁸ while [CH3OD] = 4 × 10⁻⁹). Hydroxyl-deuterated methanol thus gets enriched in deuterium through H/D exchanges with HDO, except when [s-HDO]/ [s-H2O] ≲3 × 10⁻³ where the ratio [g-CH2DOH]/ [g-CH3OD] exceeds 3.
(37)Equation (37), plotted in Fig. 5 as a dotted line, reproduces very well the ratio [g-CH2DOH]/[g-CH3OD] for all initial water deuterations over the range 10-3−10-1. Indeed, in this case the dominant reservoir of exchangeable deuterium atoms in the ice is always water ([HDO] >5 × 10⁻⁸ while [CH3OD] = 4 × 10⁻⁹). Hydroxyl-deuterated methanol thus gets enriched in deuterium through H/D exchanges with HDO, except when [s-HDO]/ [s-H2O] ≲3 × 10⁻³ where the ratio [g-CH2DOH]/ [g-CH3OD] exceeds 3.
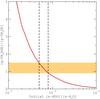 |
Fig. 5 Gas-phase abundance ratio of the singly deuterated isotopologues of methanol, [g-CH2DOH]/[g-CH3OD], as function of the initial (cold) water ice deuteration. The dotted line corresponds to Eq. (37). The ratio towards Orion KL is represented by the orange hatched zone (Neill et al. 2013). |
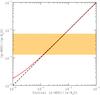 |
Fig. 6 Gas-phase deuterium fractionation of water, [g-HDO]/[g-H2O], as function of the initial water ice deuteration. The ratio observed towards Orion KL is represented by the orange hatched zone (Neill et al. 2013). |
Comparison between observational fractionation ratios in the Orion Compact Ridge hot core source and our best model.
In Fig. 6 we plotted the D/H ratio of gaseous water as function of the initial D/H ratio of water ice. As expected, the gas-phase ratio is only (and slightly) increased with respect to the initial ice-phase value when the initial [s-HDO]/[s-H2O] is lower than ~10-3. For the best value [s-HDO]/[s-H2O] = 0.6%, the [g-HDO]/[g-H2O] ratio is thus found to be 6.0 × 10⁻³. This is in good agreement with the observational values derived by Neill et al. (2013) in the Compact Ridge, [g-HDO]/[g-H2O] =  . As a result, in this source, the post-evaporative chemistry of water seems negligible.
Finally, in Table 4, we summarize the results of our best model, corresponding to an initial [s-HDO]/[s-H2O] of 0.6%. A very good agreement with the observations is obtained again, but we stress that no multiply deuterated isotopologues are detected in the Compact Ridge. Our model predicts in particular column densities for CH2DOD and CD2HOH of ~2.2 × 1013 cm-2 and ~9.2 × 1012 cm-2, respectively, corresponding to abundances (relative to nH) of 2.7 × 10⁻¹¹ and 1.2 × 10⁻¹¹.
4. Discussion
The above chemical kinetics model can be summarized by the following three phases: first, the cold accretion phase, corresponding to the prestellar stage of star formation. In this initial phase, we have assumed that the D/H ratio of both water and methanol is statistical and proceeds in the ice through the addition of H and D atoms on solid O and CO, respectively. This deuteration process takes place when the dust temperature is around 10 K and water ice is amorphous. The key parameter during this phase is the accreting D/H gas-phase ratio, which controls the level of deuteration in the ice. This parameter was fixed for methanol by assuming that the fractionation of the gas-phase CH2DOH, as observed in hot cores, reflects the primitive methanol ice deuteration. As the accreting D/H ratio increases with time (see below), as well as the O and CO depletion onto grains, a different fractionation for water was explored. At this stage, the ratio [s-CH2DOH]/[s-CH3OD] is equal to 3, which is the statistical value. In the second stage, the warm-up phase, the dust mantles are heated by the nascent protostar. In our model, the temperature jumps from 10 K to 100 K are instantaneous. During this phase, amorphous water is converted to the stable cubic crystalline form and this reorganization process is accompanied, in its very initial phase, by the mobility of water and the lability of protons and deuterons. Hydrogen isotope exchanges are triggered during this phase, as demonstrated experimentally by Faure et al. (2015). At this stage, the ratio [s-CH2DOH]/[s-CH3OD] is no longer equal to 3 because the -OH groups of methanol have equilibrated with water ice. The [s-CH2DOH]/[s-CH3OD] ratio is therefore inversely proportional to the [s-HDO]/[s-H2O] ratio. In the third stage, the hot core phase, the mantles are (partially or entirely) sublimated and the [g-CH2DOH]/[g-CH3OD] ratio established in the ice during the warm-up phase is transferred (and conserved) into the gas phase.
The main result of this work is that except for the -CH functional groups, the gas-phase molecular D/H ratios measured in hot cores cannot be employed to infer the primitive deuteration in the ices. Molecules with functional groups able to establish hydrogen bonds (e.g. -OH or -NH) are indeed expected to equilibrate with water ice during the warm-up phase, with short timescales with respect to desorption. For these species, the fractionation ratio [XD]/[XH] should scale inversely with the fractionation of water through the equilibrium constant. We have shown that this is the case for hydroxyl-deuterated methanol and that the [g-CH2DOH]/[g-CH3OD] ratios measured in hot cores reflect H/D equilibrium in water ice: ratios above the statistical value of 3 show evidence of a large fractionation of methanol relative to water, while values below 3 attest a similar fractionation for methanol and water. As a result, the [g-CH2DOH]/ [g-CH3OD] ratio is a very sensitive probe of the [s-HDO]/ [s-H2O] ratio, for which only upper limits can be determined observationally (Gálvez et al. 2011). This result certainly extends to other interstellar molecules containing different functional groups, such as formic acid (HCOOH), methylamine (CH3NH2), formamide (HCONH2), etc. We emphasize that the H/D exchange rate constant between methylamine and water has been measured in the laboratory by Faure et al. (2015). The activation energy was found to be even lower (~3300 K) than in the case of methanol. To the best of our knowledge, however, the deuterated isotopologues of CH3NH2 have not been detected yet in the ISM. Another interesting candidate is ammonia (NH3), which is abundant in ice (~5% with respect to water) and for which all multiply-deuterated isotopologues have been identified (Roueff et al. 2005). H/D exchanges between NH3 and D2O have been observed recently by Lamberts et al. (2015). H/D exchanges between water and -NH bearing molecules will be adressed in a future, dedicated study. In contrast, molecules containing only -CH functional groups, such as H2CO, should conserve their primitive fractionation. The particular case of HCN was also investigated by Faure et al. (2015) and no proton exchange was observed.
We stress that the chemical processes involved in our kinetics model are identical in low- and high-mass sources, and the main difference lies in the initial fractionation ratios. By comparing our model with hot core observations, we have thus found that the primitive deuteration of water and methanol ices was similar in the Orion Compact Ridge (αm ~ αw ~ 0.2−0.3%) while the deuteration of methanol ices was much higher than that of water in IRAS 16293-2422 (αm ~ 12% and αw ~ 1%). Our results therefore suggest that the molecular D/H ratio in the ice mantles was rather homogeneous in Orion but highly heterogeneous in IRAS 16293-2422. This result may be linked to different dynamical timescales of the prestellar core phases, the longer timescales in low-mass sources allowing a larger gas-phase [D]/[H] ratio. It is in particular striking that the level of water deuteration is similar in both sources (i.e. about 1%), while the methanol deuteration is larger by an order of magnitude in IRAS 16293-2422. The differential deuteration of the grain mantles in low-mass protostars was modelled recently by several authors (Cazaux et al. 2011; Taquet et al. 2012, 2013, 2014). In the multi-layer approach of Taquet et al., in particular, an increase of the D/H ratio towards the mantle surface is predicted. This result is a direct consequence of the increase of the accreting D/H ratio with time. In these models, the CO depletion factor and the ortho-to-para (OPR) ratio of H2 are of crucial importance because they control the abundance of the deuterated isotopologues of H , which are the main deuteron donors in the cold gas. The D/H ratios in the ice mantles can therefore vary, from prestellar core to prestellar core for a given species, and from species to species for a given core. In agreement with the results of Taquet et al. (2014), our model indicates that differential deuteration occured in the ices of IRAS 16293-2422, where the bulk of water ice was formed at low accreting D/H ratio (i.e. early times), while the bulk of methanol ices was formed at later times in a gas enriched in atomic deuterium. This does not exclude a high D/H ratio for water in the uppermost layers of the grains: these HDO molecules also equilibrate with the water bulk upon heating. In the presence of ice segregation, however, H/D exchanges might be limited because some methanol molecules may not be surrounded by water before sublimating. This might occur in ices where the methanol abundance is much higher than a few percent (see e.g. Dartois et al. 1999) in which case the gas-phase [CH2DOH]/[CH3OD] ratio could be close to statistical.
Finally, hydrogen isotope exchanges are expected to play an important role in astronomical environments other than hot cores. In the ISM, whatever the desorption mechanism, i.e. thermal heating, cosmic-ray impacts or UV photon induced desorption, accompanying changes in the structure of water ice are expected to promote H/D exchanges. In this context, it is worth mentioning the detection of CH3OH and CH2DOH in prestellar cores where the dust temperature is ~10 K (Bacmann et al. 2007; Bizzocchi et al. 2014). In these sources, the presence of gas-phase methanol demonstrates the occurence of non-thermal (or locally thermal) evaporation processes. The derived [CH2DOH]/[CH3OH] fractionation ratios were found in the range 5–30%, i.e. slightly smaller than the values measured in hot corinos, with upper limits on the column density of CH3OD corresponding to [CH2DOH]/[CH3OD] ≥ 10, i.e. much larger than the statistical value (Bacmann et al. 2007; Bizzocchi et al. 2014). This result may suggest the presence of H/D exchanges triggered by the non-thermal desorption. Another obvious application of H/D exchanges is in comets. Any molecules containing -ND or -OD groups in a cometary nucleus should indeed experience thermal H/D exchanges with water when the comet approaches the Sun. This was in fact postulated by Blake et al. (1999) to explain correlated measurements between [HDO]/[H2O] and [DCN]/[HCN] ratios in comet Hale-Bopp. H/D exchanges between HCN and water are however not supported experimentally (Faure et al. 2015). To our knowledge, no other deuterated molecules have been detected so far in comets. Results from the ROSETTA mission towards comet 67P/Churyumov-Gerasimenko should provide new clues in this context (Altwegg et al. 2015).
5. Conclusions
We have reported a simplified kinetics model of the deuterium chemistry occurring in the icy mantles of interstellar grains. The chemistry was based on a statistical initial deuteration, i.e. the statistical addition of H and D atoms on cold O and CO, followed by an instantaneous warm-up phase during which thermal H/D exchanges occur between water and methanol. The kinetic rate constants for H/D exchanges were taken from laboratory data. The model was applied to the chemistry of hot corinos and hot cores, with IRAS 16293-2422 and the Orion KL Compact Ridge as prototypes, respectively. For the first time, our model was able to reproduce quantitatively the observed gas-phase [CH2DOH]/[CH3OD] ratios, which are found to scale inversely with [HDO]/[H2O] owing to the H/D exchange equilibrium between the hydroxyl (-OH) functional groups of methanol and water in the ice. Primitive fractionations of water ice [HDO]/[H2O] ~ 2% in IRAS 16293-2422 and ~0.6% in the Compact Ridge were deduced, suggesting highly hetereogeneous D/H ratios in the ices of IRAS 16293-2422. Molecules with functional groups able to establish hydrogen bonds (e.g. -OH or -NH) are thus expected to equilibrate with water ice during any thermal (or non-thermal) heating event. Similar results are expected in other astronomical environments, in particular, in cometary nuclei. This shows the relevance of using a reduced microphysics code based on laboratory experiments to interpret astronomical observations. We therefore strongly recommend incorporating the H/D exchange kinetic data in any detailed model of the deuterium chemistry in interstellar or cometary ices.
A theoretical value can be obtained from the ab initio data published in Hewitt et al. (2005).
Slightly larger values were derived for the other low-mass sources IRA4A, IRAS4B and IRAS2 (Parise et al. 2006).
Acknowledgments
This work was supported by the CNRS program “Physique et Chimie du Milieu Interstellaire” (PCMI). One of us (M.F.) is also supported by a fellowship of the Ministère de l’Enseignement Supérieur et de la Recherche. Aurore Bacmann, Pierre Hily-Blant and Sébastien Maret are acknowledged for useful discussions.
References
- Altwegg, K., Balsiger, H., Bar-Nun, A., et al. 2015, Science, 347, 1261952 [Google Scholar]
- Bacmann, A., Lefloch, B., Parise, B., Ceccarelli, C., & Steinacker, J. 2007, in Molecules in Space and Laboratory, 9 [Google Scholar]
- Bertrand, G.-L., & Burchfield, T.-E. 1975, J. Phys. Chem., 79, 1547 [CrossRef] [Google Scholar]
- Bizzocchi, L., Caselli, P., Spezzano, S., & Leonardo, E. 2014, A&A, 569, A27 [NASA ADS] [CrossRef] [EDP Sciences] [Google Scholar]
- Blake, G. A., Qi, C., Hogerheijde, M. R., Gurwell, M. A., & Muhleman, D. O. 1999, Nature, 398, 213 [NASA ADS] [CrossRef] [PubMed] [Google Scholar]
- Brown, W. A., & Bolina, A. S. 2007, MNRAS, 374, 1006 [NASA ADS] [CrossRef] [Google Scholar]
- Burke, D. J., & Brown, W. A. 2010, Phys. Chem. Chem. Phys., 12, 5947 [NASA ADS] [CrossRef] [PubMed] [Google Scholar]
- Cazaux, S., Caselli, P., & Spaans, M. 2011, ApJ, 741, L34 [NASA ADS] [CrossRef] [Google Scholar]
- Ceccarelli, C., Caselli, P., Bockelée-Morvan, D., et al. 2014, Protostars and Planets VI, 859 [Google Scholar]
- Chandler, C. J., Brogan, C. L., Shirley, Y. L., & Loinard, L. 2005, ApJ, 632, 371 [NASA ADS] [CrossRef] [Google Scholar]
- Charnley, S. B., Tielens, A. G. G. M., & Rodgers, S. D. 1997, ApJ, 482, L203 [NASA ADS] [CrossRef] [Google Scholar]
- Collier, W.-B., Ritzhaupt, G., & Devlin, J.-P. 1984, J. Phys. Chem., 88, 363 [CrossRef] [Google Scholar]
- Collings, M. P., Anderson, M. A., Chen, R., et al. 2004, MNRAS, 354, 1133 [NASA ADS] [CrossRef] [Google Scholar]
- Coutens, A., Vastel, C., Caux, E., et al. 2012, A&A, 539, A132 [NASA ADS] [CrossRef] [EDP Sciences] [Google Scholar]
- Coutens, A., Vastel, C., Cazaux, S., et al. 2013, A&A, 553, A75 [NASA ADS] [CrossRef] [EDP Sciences] [Google Scholar]
- Dartois, E., Schutte, W., Geballe, T. R., et al. 1999, A&A, 342, L32 [NASA ADS] [Google Scholar]
- Dartois, E., Thi, W., Geballe, T. R., et al. 2003, A&A, 399, 1009 [NASA ADS] [CrossRef] [EDP Sciences] [Google Scholar]
- Faure, M., Quirico, E., Faure, A., et al. 2015, Icarus, 261, 14 [NASA ADS] [CrossRef] [Google Scholar]
- Fenby, D. V., & Bertrand, G.-L. 1982, Aust. J. Chem., 35, 237 [CrossRef] [Google Scholar]
- Fisher, M., & Devlin, J.-P. 1995, J. Phys. Chem., 99, 11584 [CrossRef] [Google Scholar]
- Fraser, H. J., Collings, M. P., McCoustra, M. R. S., & Williams, D. A. 2001, MNRAS, 327, 1165 [NASA ADS] [CrossRef] [Google Scholar]
- Fumagalli, M., O’Meara, J. M., & Prochaska, J. X. 2011, Science, 334, 1245 [NASA ADS] [CrossRef] [Google Scholar]
- Gálvez, Ó., Maté, B., Herrero, V. J., & Escribano, R. 2011, ApJ, 738, 133 [NASA ADS] [CrossRef] [Google Scholar]
- Garrod, R., Park, I. H., Caselli, P., & Herbst, E. 2006, Faraday Discussions, 133, 51 [Google Scholar]
- Geiss, J., & Gloeckler, G. 1998, Space Sci. Rev., 84, 239 [NASA ADS] [CrossRef] [Google Scholar]
- Geppert, W. D., Hamberg, M., Thomas, R. D., et al. 2006, Faraday Discussions, 133, 177 [Google Scholar]
- Gibson, K. D., Killelea, D. R., Yuan, H., Becker, J. S., & Sibener, S. J. 2011, J. Chem. Phys., 134, 034703 [NASA ADS] [CrossRef] [Google Scholar]
- Hasegawa, T. I., Herbst, E., & Leung, C. M. 1992, ApJS, 82, 167 [NASA ADS] [CrossRef] [Google Scholar]
- Hewitt, A. J., Doss, N., Zobov, N. F., Polyansky, O. L., & Tennyson, J. 2005, MNRAS, 356, 1123 [NASA ADS] [CrossRef] [Google Scholar]
- Hindmarsh, A.-C. 1983, in Scientific computing, eds. R.-S. Stepleman et al. (Amsterdam: North-Holland), 1, 55 [Google Scholar]
- Jacq, T., Walmsley, C. M., Mauersberger, R., et al. 1993, A&A, 271, 276 [NASA ADS] [Google Scholar]
- Lamberts, T., Ioppolo, S., Cuppen, H., Fedoseev, G., & Linnartz, H. 2015, MNRAS, 448, 3820 [NASA ADS] [CrossRef] [Google Scholar]
- Lee, J.-E., & Bergin, E. A. 2015, ApJ, 799, 104 [NASA ADS] [CrossRef] [Google Scholar]
- Linsky, J. L. 2007, Space Sci. Rev., 130, 367 [NASA ADS] [CrossRef] [Google Scholar]
- Maret, S., Ceccarelli, C., Tielens, A. G. G. M., et al. 2005, A&A, 442, 527 [NASA ADS] [CrossRef] [EDP Sciences] [Google Scholar]
- Mispelaer, F., Theule, P., Duvernay, F., Roubin, P., & Chiavassa, T. 2012, A&A, 540, A40 [NASA ADS] [CrossRef] [EDP Sciences] [Google Scholar]
- Nagaoka, A., Watanabe, N., & Kouchi, A. 2005, ApJ, 624, L29 [NASA ADS] [CrossRef] [Google Scholar]
- Nagaoka, A., Watanabe, N., & Kouchi, A. 2007, J. Phys. Chem. A, 111, 3016 [CrossRef] [Google Scholar]
- Neill, J. L., Crockett, N. R., Bergin, E. A., Pearson, J. C., & Xu, L.-H. 2013, ApJ, 777, 85 [NASA ADS] [CrossRef] [Google Scholar]
- Öberg, K. I., Boogert, A. C. A., Pontoppidan, K. M., et al. 2011, ApJ, 740, 109 [NASA ADS] [CrossRef] [Google Scholar]
- Osamura, Y., Roberts, H., & Herbst, E. 2004, A&A, 421, 1101 [NASA ADS] [CrossRef] [EDP Sciences] [Google Scholar]
- Parise, B., Simon, T., Caux, E., et al. 2003, A&A, 410, 897 [NASA ADS] [CrossRef] [EDP Sciences] [Google Scholar]
- Parise, B., Castets, A., Herbst, E., et al. 2004, A&A, 416, 159 [NASA ADS] [CrossRef] [EDP Sciences] [Google Scholar]
- Parise, B., Ceccarelli, C., Tielens, A. G. G. M., et al. 2006, A&A, 453, 949 [NASA ADS] [CrossRef] [EDP Sciences] [Google Scholar]
- Park, S.-C., Jung, K.-H., & Kang, H. 2004, J. Chem. Phys., 121, 2765 [NASA ADS] [CrossRef] [Google Scholar]
- Park, S.-C., Moon, E.-S., & Kang, H. 2010, Phys. Chem. Chem. Phys., 12, 12000 [CrossRef] [Google Scholar]
- Peng, T.-C., Despois, D., Brouillet, N., Parise, B., & Baudry, A. 2012, A&A, 543, A152 [NASA ADS] [CrossRef] [EDP Sciences] [Google Scholar]
- Persson, M. V., Jørgensen, J. K., & van Dishoeck, E. F. 2013, A&A, 549, L3 [NASA ADS] [CrossRef] [EDP Sciences] [Google Scholar]
- Persson, M. V., Jørgensen, J. K., van Dishoeck, E. F., & Harsono, D. 2014, A&A, 563, A74 [NASA ADS] [CrossRef] [EDP Sciences] [Google Scholar]
- Ratajczak, A., Quirico, E., Faure, A., Schmitt, B., & Ceccarelli, C. 2009, A&A, 496, L21 [NASA ADS] [CrossRef] [EDP Sciences] [Google Scholar]
- Ratajczak, A., Taquet, V., Kahane, C., et al. 2011, A&A, 528, L13 [NASA ADS] [CrossRef] [EDP Sciences] [Google Scholar]
- Richet, P., Bottinga, Y., & Janoy, M. 1977, Ann. Rev. Earth Plan. Sci., 5, 65 [Google Scholar]
- Roberts, H., Herbst, E., & Millar, T. J. 2003, ApJ, 591, L41 [NASA ADS] [CrossRef] [Google Scholar]
- Rodgers, S. D., & Millar, T. J. 1996, MNRAS, 280, 1046 [NASA ADS] [CrossRef] [Google Scholar]
- Roueff, E., Lis, D. C., van der Tak, F. F. S., Gerin, M., & Goldsmith, P. F. 2005, A&A, 438, 585 [NASA ADS] [CrossRef] [EDP Sciences] [Google Scholar]
- Sandford, S. A., & Allamandola, L. J. 1988, Icarus, 76, 201 [NASA ADS] [CrossRef] [Google Scholar]
- Simonson, J.-M. 1990, J. Chem. Thermodyn., 22, 739 [CrossRef] [Google Scholar]
- Sipilä, O., Caselli, P., & Harju, J. 2013, A&A, 554, A92 [NASA ADS] [CrossRef] [EDP Sciences] [Google Scholar]
- Smith, R. S., & Kay, B. D. 1999, Nature, 398, 788 [NASA ADS] [CrossRef] [Google Scholar]
- Souda, R., Kawanowa, H., Kondo, M., & Gotoh, Y. 2003, J. Chem. Phys., 119, 6194 [NASA ADS] [CrossRef] [Google Scholar]
- Taquet, V., Ceccarelli, C., & Kahane, C. 2012, ApJ, 748, L3 [NASA ADS] [CrossRef] [Google Scholar]
- Taquet, V., Peters, P. S., Kahane, C., et al. 2013, A&A, 550, A127 [NASA ADS] [CrossRef] [EDP Sciences] [Google Scholar]
- Taquet, V., Charnley, S. B., & Sipilä, O. 2014, ApJ, 791, 1 [NASA ADS] [CrossRef] [Google Scholar]
- Watanabe, N., Mouri, O., Nagaoka, A., et al. 2007, ApJ, 668, 1001 [NASA ADS] [CrossRef] [Google Scholar]
- Zhang, B., & Martin, M.-L. 1992, J. Am. Chem. Soc., 114, 7089 [CrossRef] [Google Scholar]
All Tables
Comparison between observational fractionation ratios in the IRAS 16293-2422 hot corino source and our best model.
Comparison between observational fractionation ratios in the Orion Compact Ridge hot core source and our best model.
All Figures
|
Fig. 1 Gas phase and ice abundance of CH3OH as a function of grain temperature. The abundance observed towards IRAS 16293-2422 is represented by the orange hatched zone (Parise et al. 2004). The solid vertical dashed line denotes the standard hot-core dust temperature Td = 100 K. See text for details. |
| In the text | |
|
Fig. 2 Gas-phase abundance ratio of the singly deuterated isotopologues of methanol, [g-CH2DOH]/[g-CH3OD], as function of the initial water ice deuteration. The dust temperature is taken as 100 K. The dotted line corresponds to Eq. (36). The ratio observed towards IRAS 16293-2422 is represented by the orange hatched zone (Parise et al. 2004). |
| In the text | |
|
Fig. 3 Gas-phase deuterium fractionation of water, [g-HDO]/[g-H2O], as function of the initial water ice deuteration. The ratio observed towards IRAS 16293-2422 is represented by the orange hatched zone (Coutens et al. 2013). |
| In the text | |
|
Fig. 4 Gas phase and ice abundance of CH3OH as a function of grain temperature. The abundance towards Orion KL is represented by the orange hatched zone (Neill et al. 2013). The solid vertical dashed line denotes Td = 100 K. See text for details. |
| In the text | |
|
Fig. 5 Gas-phase abundance ratio of the singly deuterated isotopologues of methanol, [g-CH2DOH]/[g-CH3OD], as function of the initial (cold) water ice deuteration. The dotted line corresponds to Eq. (37). The ratio towards Orion KL is represented by the orange hatched zone (Neill et al. 2013). |
| In the text | |
|
Fig. 6 Gas-phase deuterium fractionation of water, [g-HDO]/[g-H2O], as function of the initial water ice deuteration. The ratio observed towards Orion KL is represented by the orange hatched zone (Neill et al. 2013). |
| In the text | |
Current usage metrics show cumulative count of Article Views (full-text article views including HTML views, PDF and ePub downloads, according to the available data) and Abstracts Views on Vision4Press platform.
Data correspond to usage on the plateform after 2015. The current usage metrics is available 48-96 hours after online publication and is updated daily on week days.
Initial download of the metrics may take a while.