Fig. 7
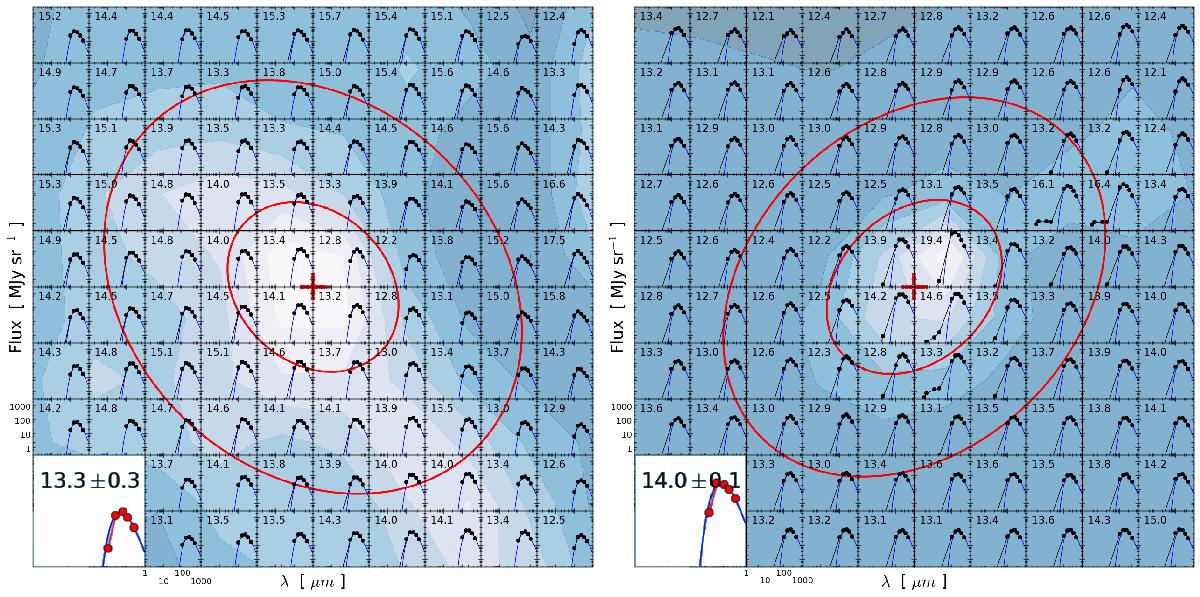
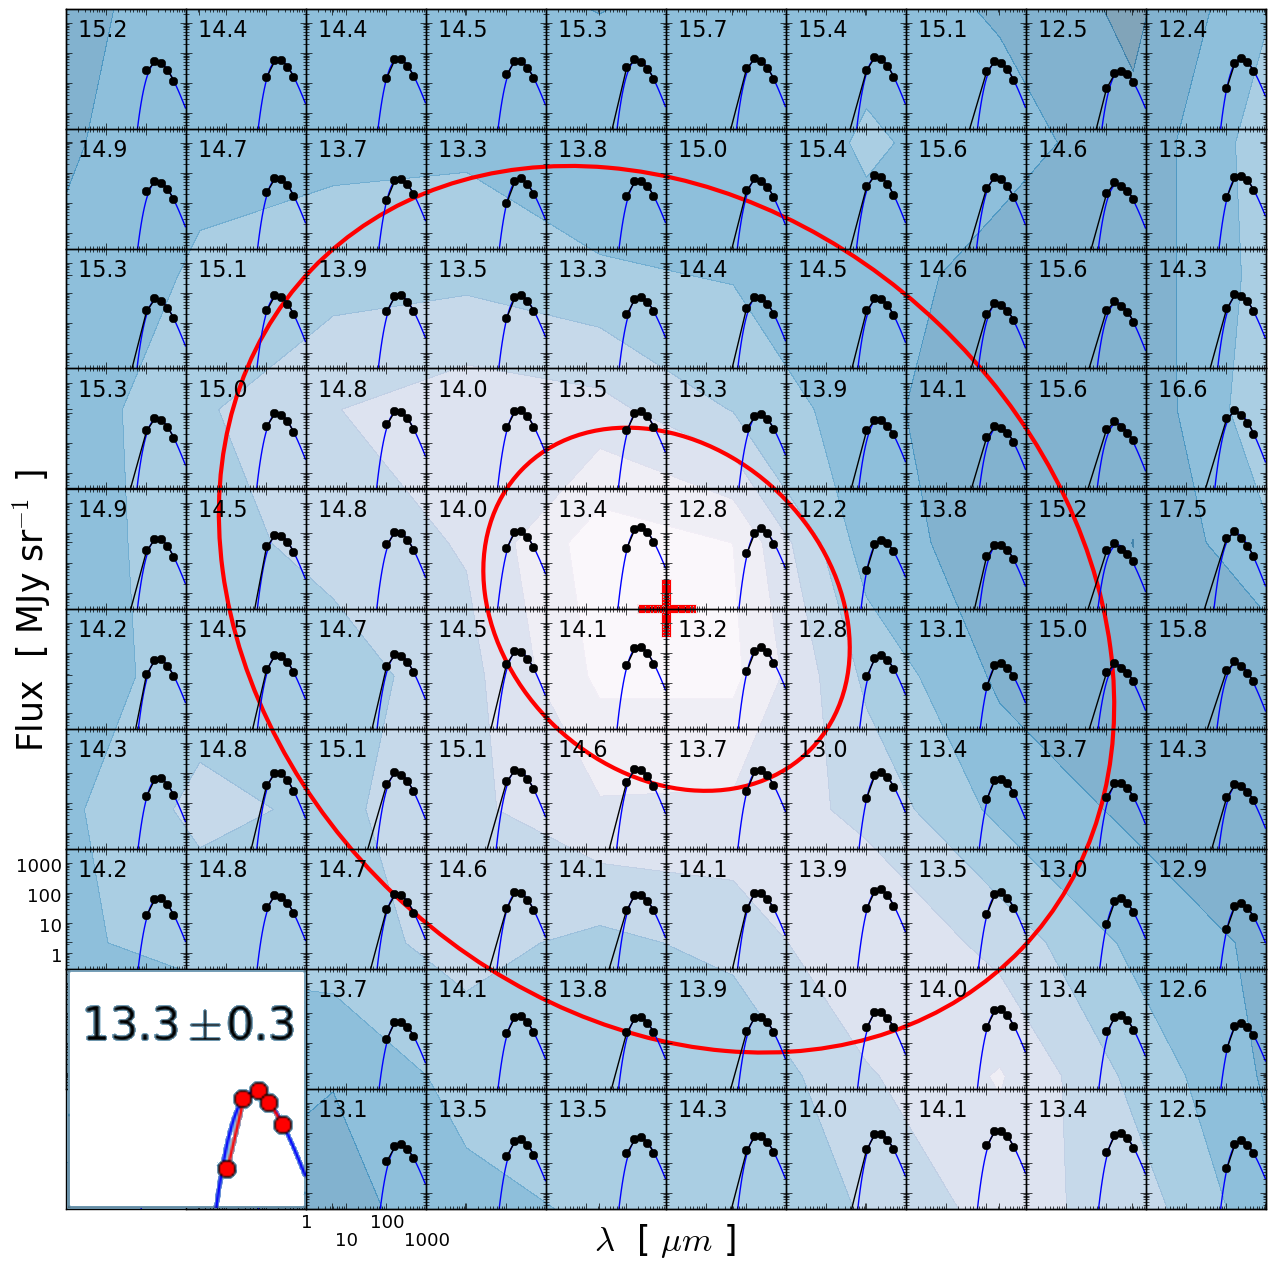
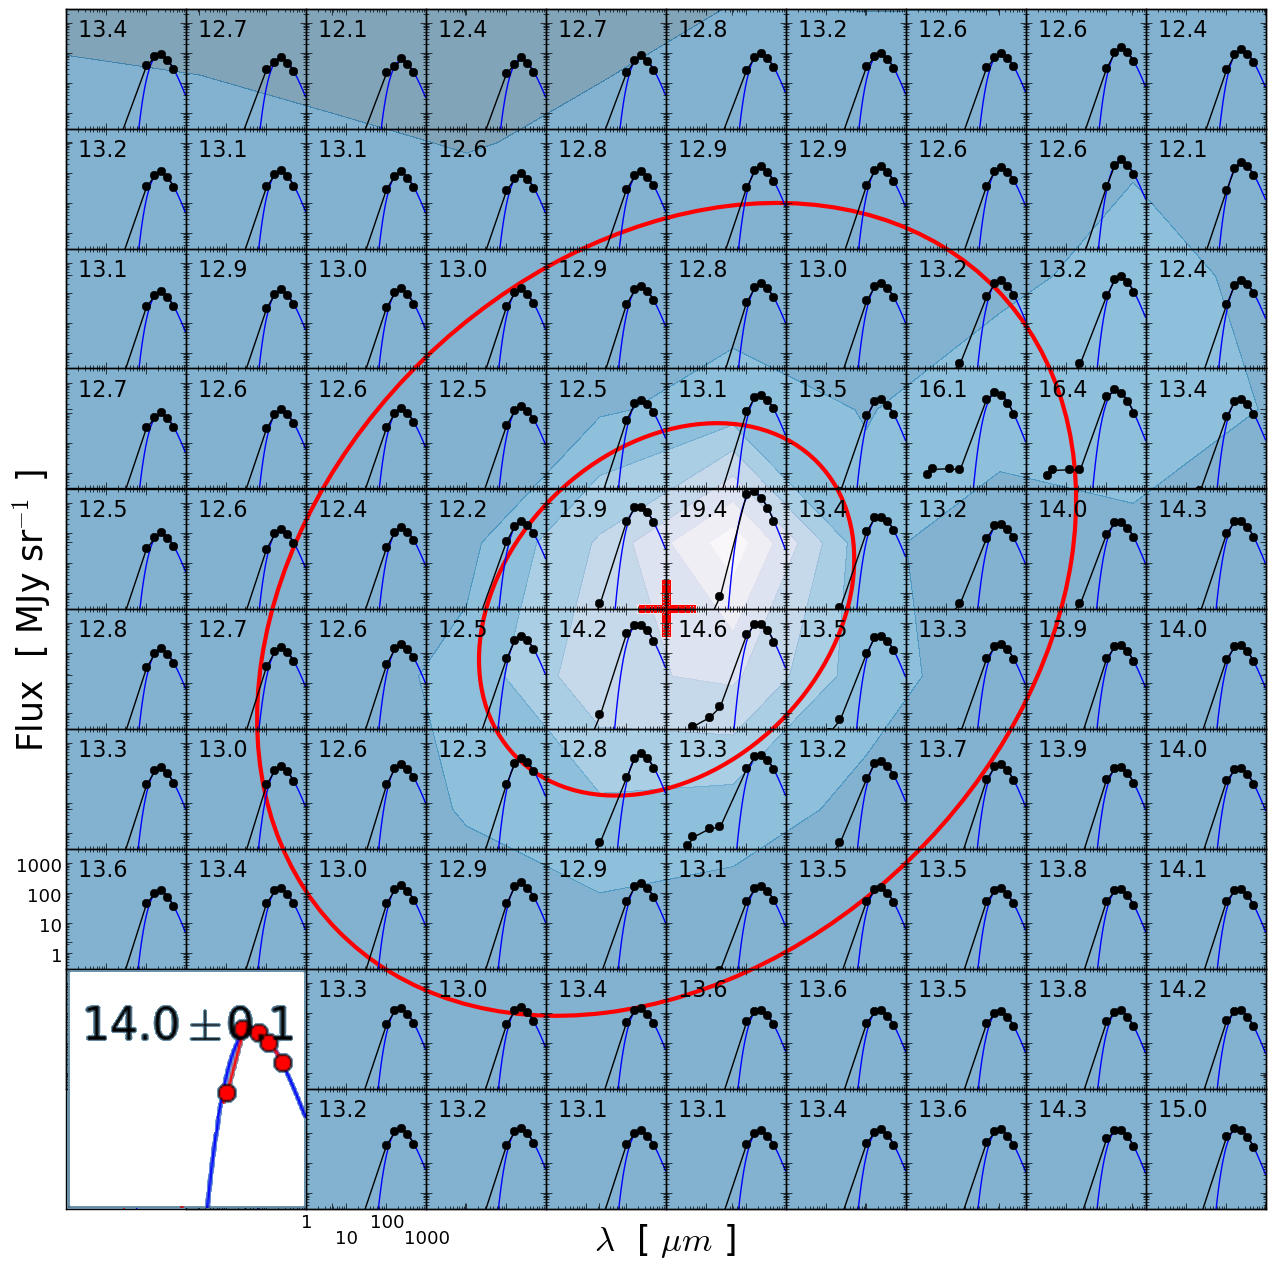
Pixel-by-pixel spectral energy distributions of a starless cold core (left; source ID = 1466, α = 100.32654, δ = 10.42901, in G202.02+2.85) and a cold core hosting a known young stellar object (right; source ID = 3863, α = 343.42069, δ = 62.533048, in G109.80+2.70 = PCC288). Each pixel is 20′′. Shown are the fluxes at 100 and 160 μm from PACS and 250, 350, and 500 μm from SPIRE. The fluxes at 3.4, 4.6, 12, and 22 μm from WISE are also shown, but are high enough to be visible only near the protostar in the right panel. The blue lines are the best fit of the four longest wavelengths using a modified black body with a fixed spectral index β = 2. The corresponding colour temperature is indicated in the top left corner of each pixel, in units of kelvin. The backgrounds are filled contour maps of the 250 μm surface brightness. The large and small red ellipses are the FWHM and footprint of the sources, respectively, as given by getsources for the column density map. The red cross shows the centre position of the source. In the bottom left corners, red points show the SED derived from getsources total fluxes of the sources for 160 μm from PACS and 250, 350, and 500 μm from SPIRE.

Current usage metrics show cumulative count of Article Views (full-text article views including HTML views, PDF and ePub downloads, according to the available data) and Abstracts Views on Vision4Press platform.
Data correspond to usage on the plateform after 2015. The current usage metrics is available 48-96 hours after online publication and is updated daily on week days.
Initial download of the metrics may take a while.