Fig. 6
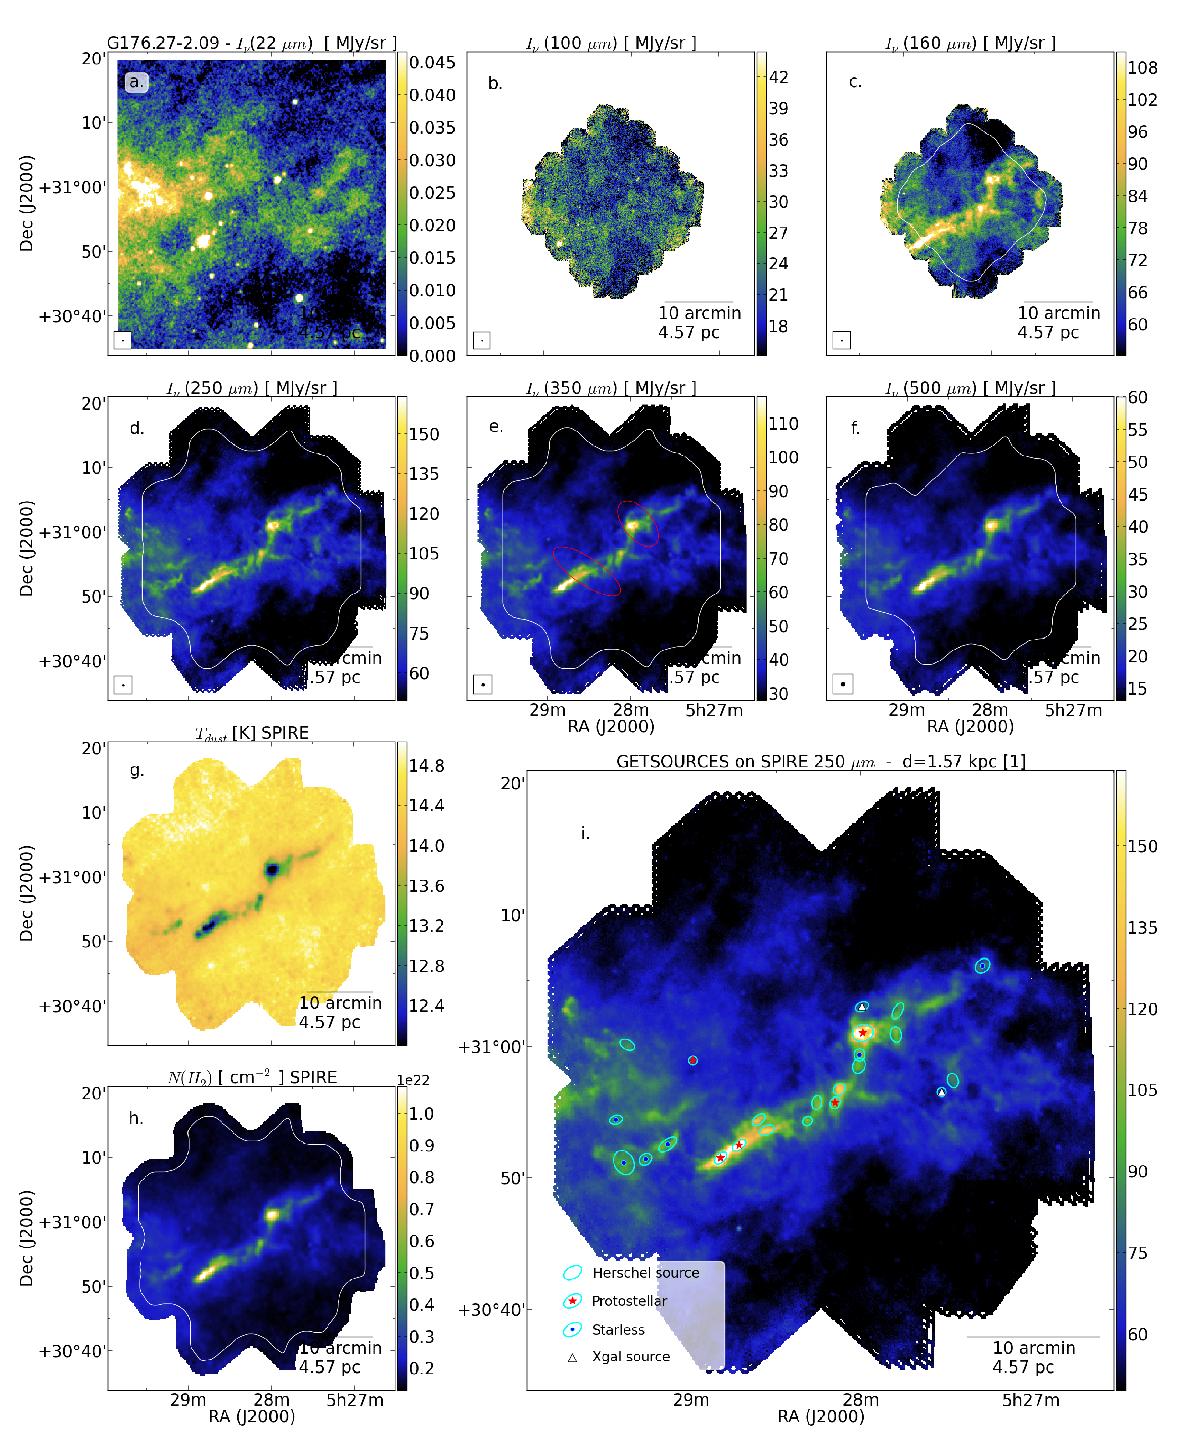
Data on the field G176.27-2.09. Shown are the surface brightness maps for WISE 22 μm (frame a), 12′′ resolution), PACS 100 μm (frame b), 7.7′′ resolution), PACS 160 μm (frame c), 12′′ resolution), SPIRE 250 μm (frame d), 18.1′′ resolution), SPIRE 350 μm (frame e), 25.2′′ resolution), and SPIRE 500 μm (frame f), 38.5′′ resolution). The dust colour temperature map (frame g), 40′′ resolution) and H2 column density map (frame h), 40′′ resolution) are derived from SPIRE data. The beam sizes are indicated in the lower left corner of each frame. The FWHM ellipses of sources are shown in frame i) plotted on the SPIRE 250 μm map. Candidate galaxies, protostellar, and starless sources are indicated with white triangles, red stars, and blue filled circles, respectively. Ellipses without additional symbols are galactic sources at an undetermined stage of evolution. The red ellipses in frame e) show the positions of Planck sources from the PGCC catalogue (Planck Collaboration XXVIII 2015). In frames c)−f), and h), the white solid line shows the boundary of the mask employed for the source extraction.
Current usage metrics show cumulative count of Article Views (full-text article views including HTML views, PDF and ePub downloads, according to the available data) and Abstracts Views on Vision4Press platform.
Data correspond to usage on the plateform after 2015. The current usage metrics is available 48-96 hours after online publication and is updated daily on week days.
Initial download of the metrics may take a while.