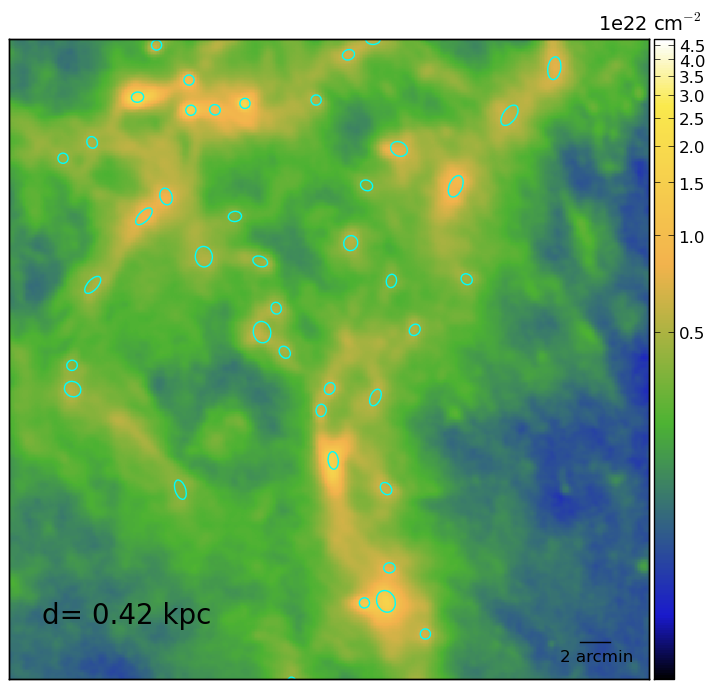
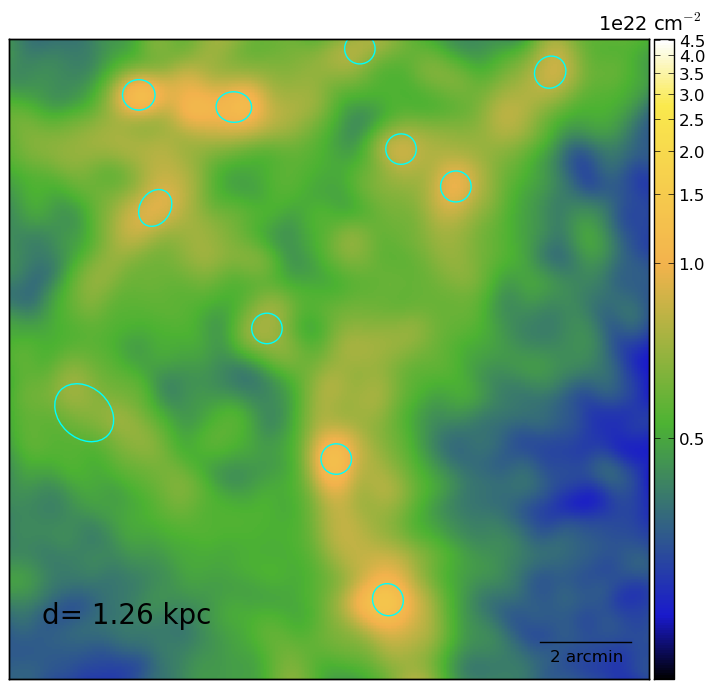
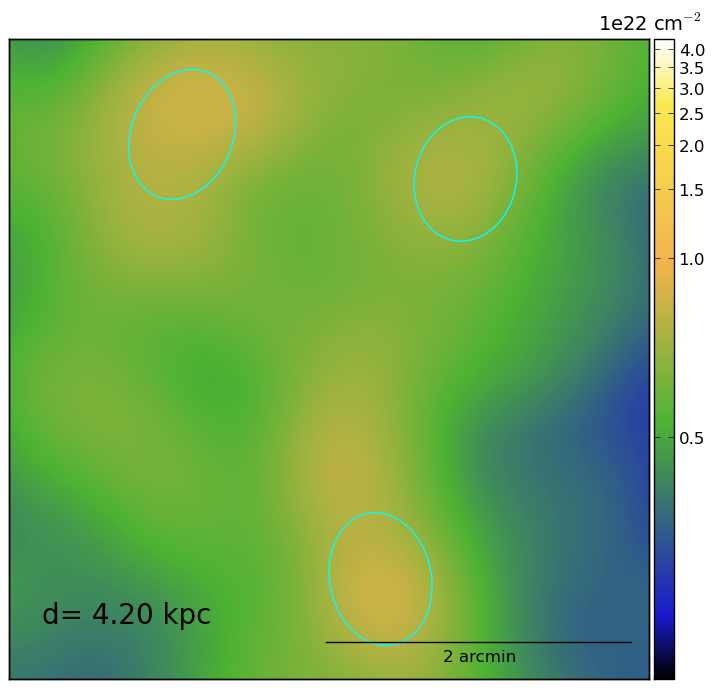
Fig. C.1
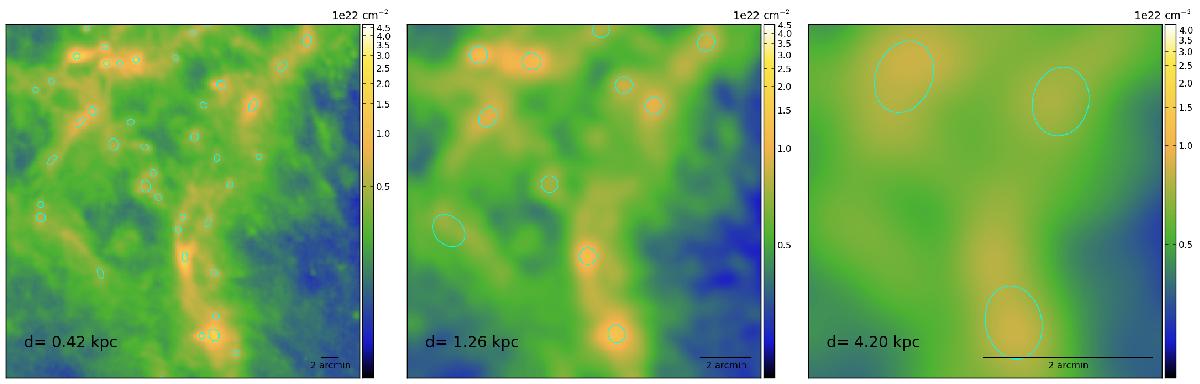
Left: close-up view of G163.82-8.44 centred at RA = 4h28m01.8s Dec = +36°45m51.87s. The colour scale shows the H2 column density derived from SPIRE data. The cyan ellipses show the FWHM of the sources obtained using getsources. Middle and right frames show the same field with simulated distances 3 and 10 times greater than the estimated distance of 0.42 kpc.

Current usage metrics show cumulative count of Article Views (full-text article views including HTML views, PDF and ePub downloads, according to the available data) and Abstracts Views on Vision4Press platform.
Data correspond to usage on the plateform after 2015. The current usage metrics is available 48-96 hours after online publication and is updated daily on week days.
Initial download of the metrics may take a while.