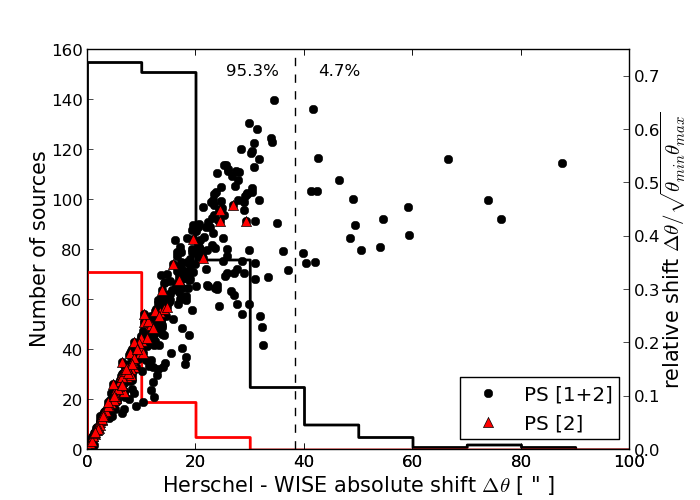
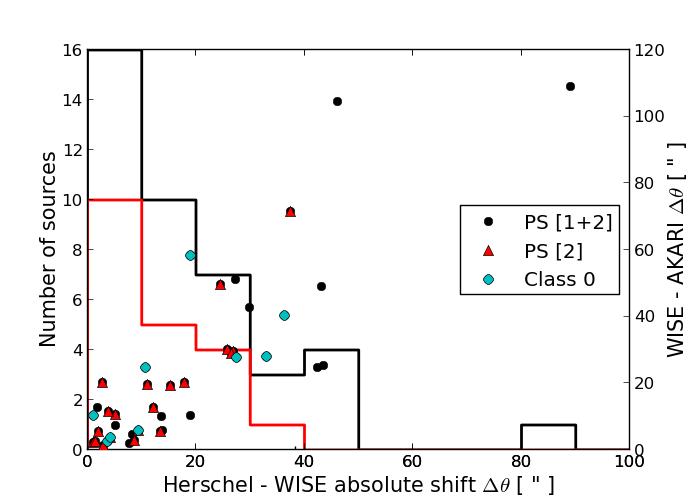
Fig. A.1
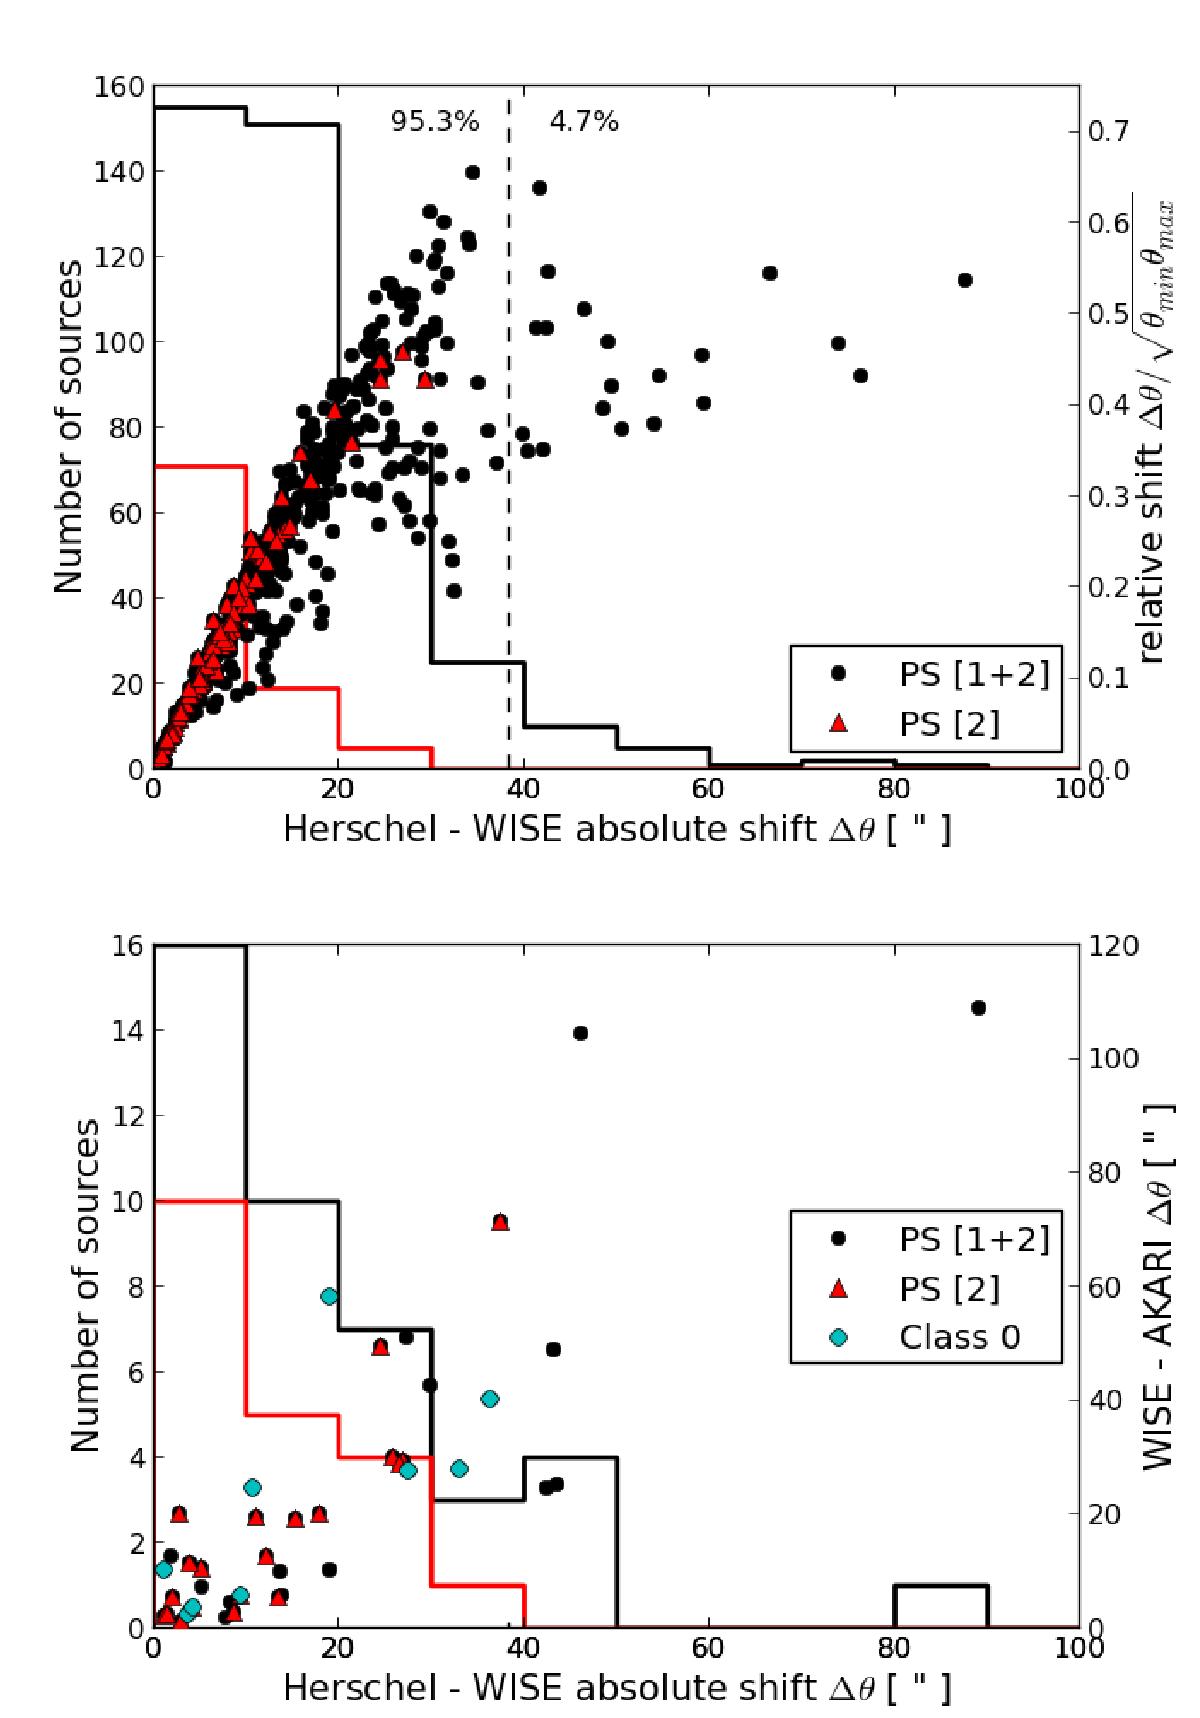
Distribution of the shift between the centre of the Herschel sources and the matching WISE sources. The black histogram and black circles show the shift distribution regardless of the classification method flag. The red histogram and red triangles show the shift distribution of sources with flag 2, i.e. classified as protostellar by methods A and B (Sect. 4.4.3). Upper panel: protostellar sources with embedded Class I and/or Class II YSOs. The scatter plot shows the correlation between the absolute and relative shifts with respect to the Herschel source size. The vertical dashed line shows the beam size. Lower panel: protostellar sources with AKARI 65 μm counterparts. Blue circles show sources classified as protostellar with embedded Class 0 YSOs. The scatter plot shows the absolute shift in WISE and AKARI source positions as a function of the absolute shift in WISE and Herschel source positions.
Current usage metrics show cumulative count of Article Views (full-text article views including HTML views, PDF and ePub downloads, according to the available data) and Abstracts Views on Vision4Press platform.
Data correspond to usage on the plateform after 2015. The current usage metrics is available 48-96 hours after online publication and is updated daily on week days.
Initial download of the metrics may take a while.