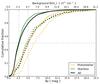
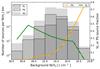
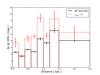
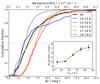
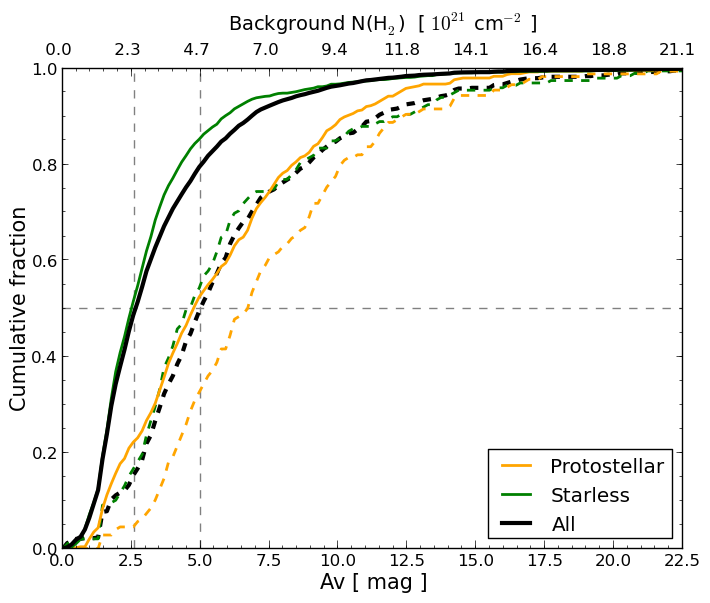
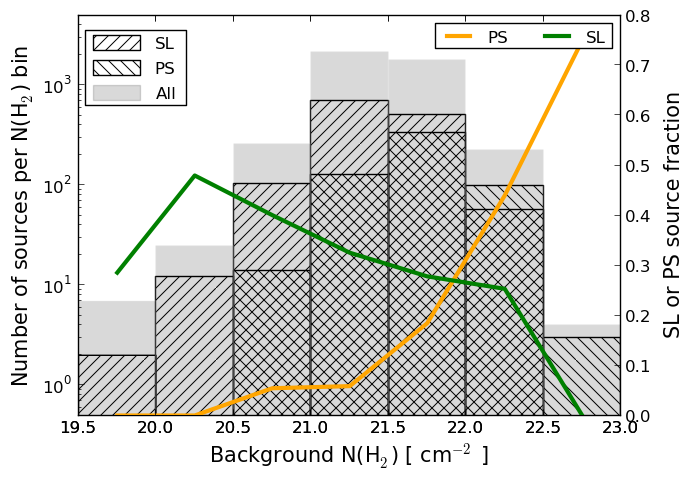
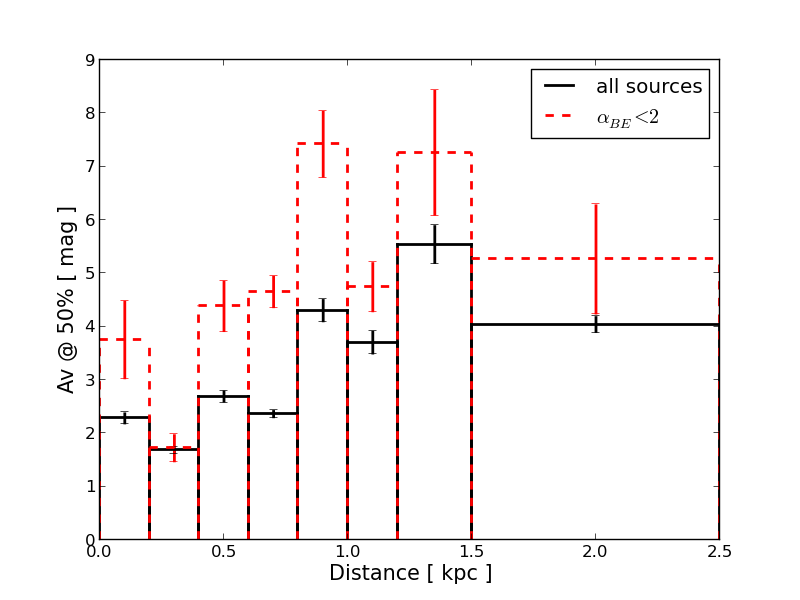
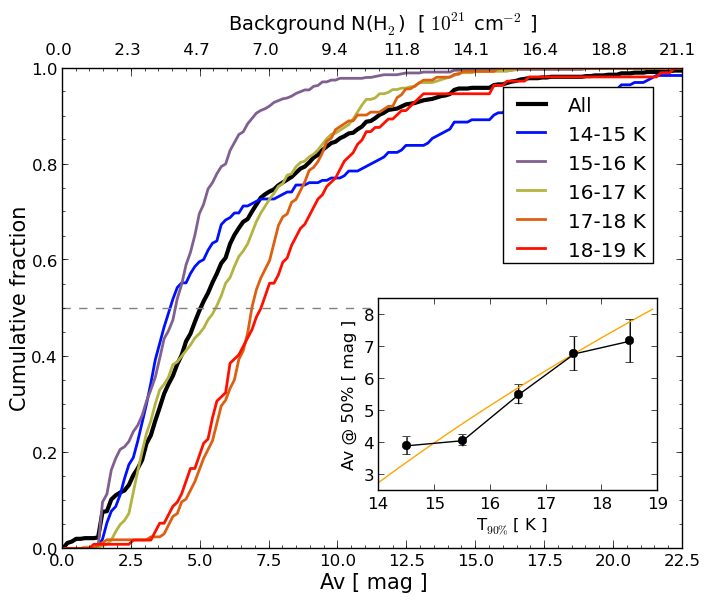
Fig. 17
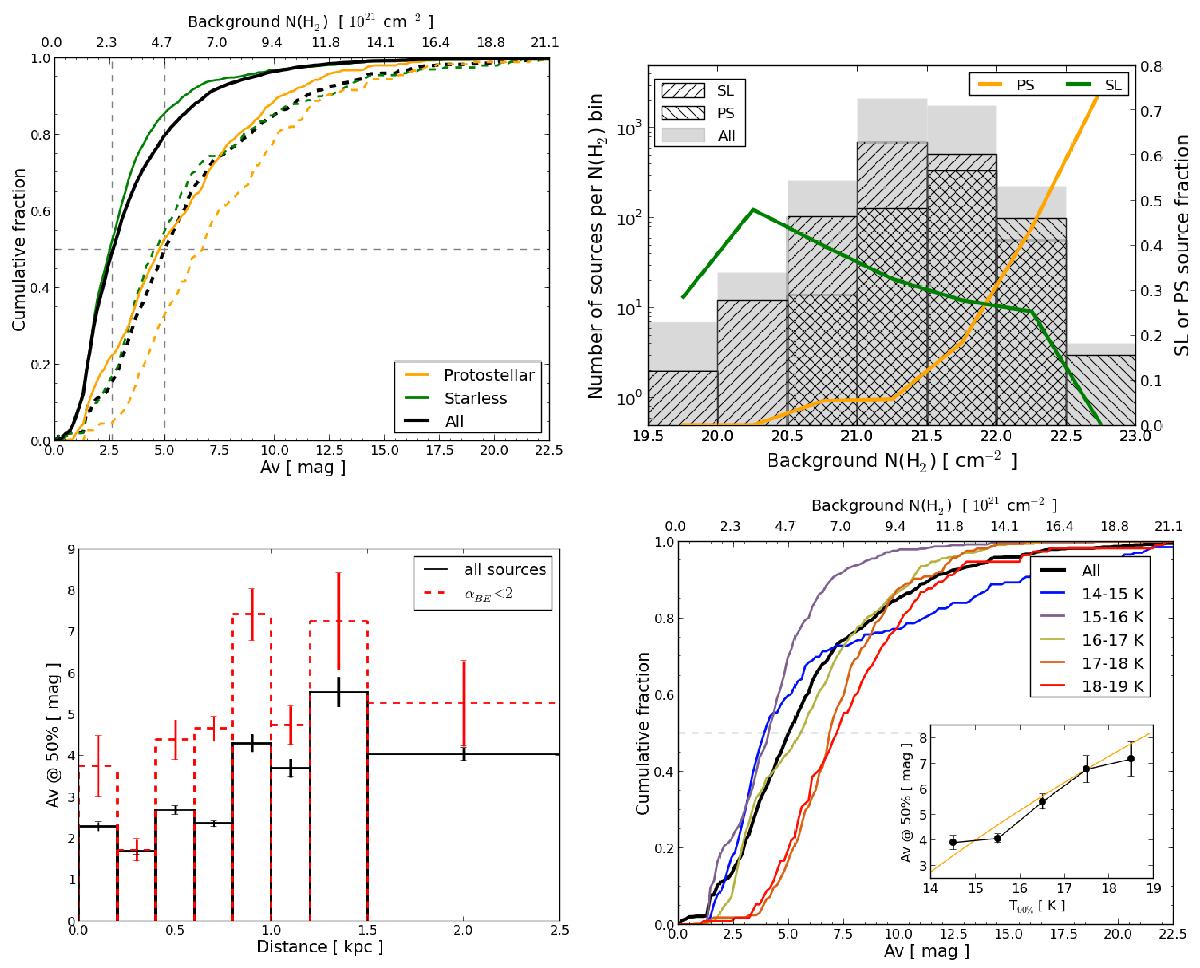
Cumulative fraction of sources as a function of the background visual extinction. The top left frame compares starless (green) and protostellar (orange) sources. Solid lines are for all sources, dashed lines are for cores with αBE< 2. The top right frame shows, for all sources, the number of sources per bin of background column density and the mean fraction of starless (SL, green line) and protostellar (PS, orange line) sources in each bin. The bottom left frame shows the values of visual extinction AV at 50% of cumulative fraction for different bins of distance. Solid black lines are for all sources, red dashed lines for cores with αBE< 2. The bottom right frame shows the cumulative fractions for sources with αBE< 2 obtained per bin of field 9th decile temperatures T90%. The insert shows the variations in visual extinction AV at 50% of cumulative fraction as a function of T90%. The orange solid line shows Eq. (7) for β = 2, α = 4.5, and Tth = 12 K without fitting the data. The error bars in the insert and in the bottom left frame are proportional to 1/![]() , where Nsources is the number of sources in the bin of T90% or distance. It assumes that the uncertainty on the AV estimate of each source is 100%.
, where Nsources is the number of sources in the bin of T90% or distance. It assumes that the uncertainty on the AV estimate of each source is 100%.
Current usage metrics show cumulative count of Article Views (full-text article views including HTML views, PDF and ePub downloads, according to the available data) and Abstracts Views on Vision4Press platform.
Data correspond to usage on the plateform after 2015. The current usage metrics is available 48-96 hours after online publication and is updated daily on week days.
Initial download of the metrics may take a while.