Fig. 15
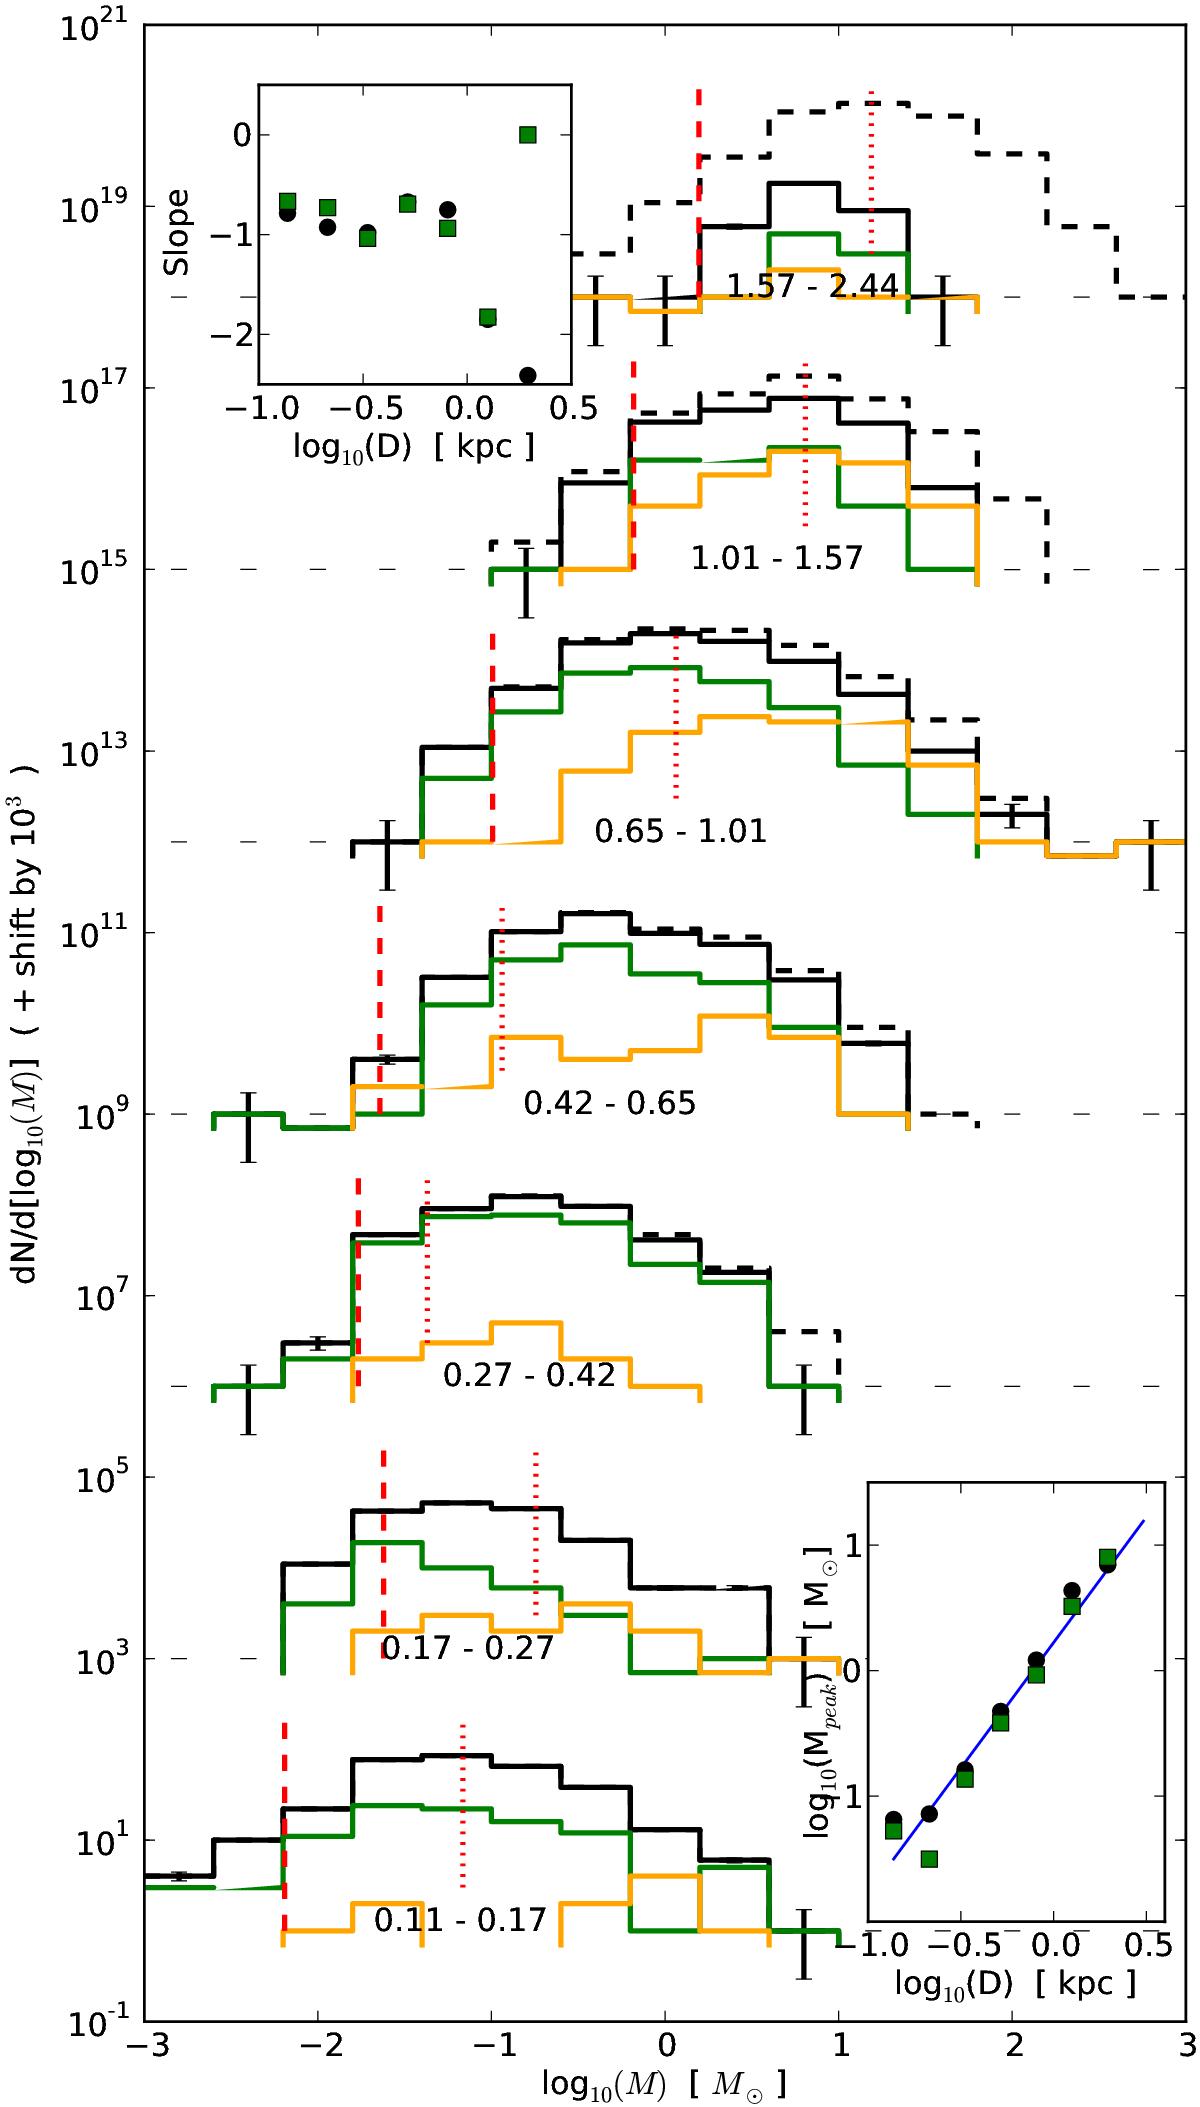
Core mass function (CMF) per bin of distance. The corresponding upper and lower limits of distance bins are indicated below each CMF in units of kpc. Black dashed lines are for all sources (cores + clumps), black solid lines are for all cores, and green lines for starless cores. The error bars represent the statistical error. Red vertical dashed and dotted lines show the geometrical mean of completeness at 50% and 90%, respectively (see text for details). The y-axis is set for the lower distance bin. A vertical shift by 103 was added for each next upper distance bin. The bottom right insert shows the peak positions of every CMF, defined as the peak of the best log-normal fit, as a function of the central values of distance bins. The top left insert shows the slope dN/ d(log M) of the power-law fit of the high-mass tail as a function of the central values of distance bins. In both inserts, black circles are for CMF of all sources, green squares are for starless sources. The blue solid line shows the Mpeak ∝ D2 relation.
Current usage metrics show cumulative count of Article Views (full-text article views including HTML views, PDF and ePub downloads, according to the available data) and Abstracts Views on Vision4Press platform.
Data correspond to usage on the plateform after 2015. The current usage metrics is available 48-96 hours after online publication and is updated daily on week days.
Initial download of the metrics may take a while.