Fig. 14
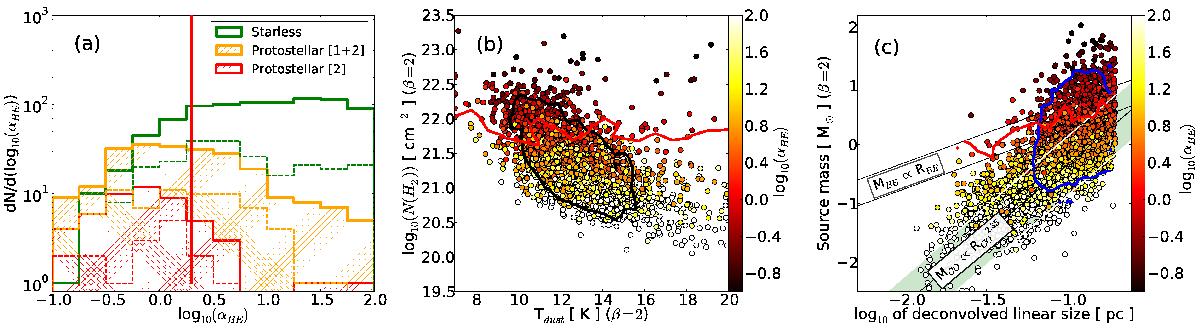
Stability of sources as measured from the mass ratio αBE. Only sources classified as cores and with distance flags 1 or 2 are shown. a) Starless (green) vs. protostellar (orange hatched) cores for all distances (solid lines) and for distance estimates between 500 and 800 pc (dashed lines). The vertical red line indicates the αBE = 2 position. b)αBE is colour coded and represented against N(H2) and Tdust, as in Fig. 12. The black contour is repeated from Fig. 12. c)αBE is colour coded and represented against cores mass and deconvolved linear size. The blue contour shows the loci of cores with distance estimates between 500 and 800 pc. As a comparison, the pale green band and white lines show the correlation observed for CO clumps (Elmegreen & Falgarone 1996). The red lines in frames b) and c) show the αBE = 2 contours.
Current usage metrics show cumulative count of Article Views (full-text article views including HTML views, PDF and ePub downloads, according to the available data) and Abstracts Views on Vision4Press platform.
Data correspond to usage on the plateform after 2015. The current usage metrics is available 48-96 hours after online publication and is updated daily on week days.
Initial download of the metrics may take a while.