Fig. 13
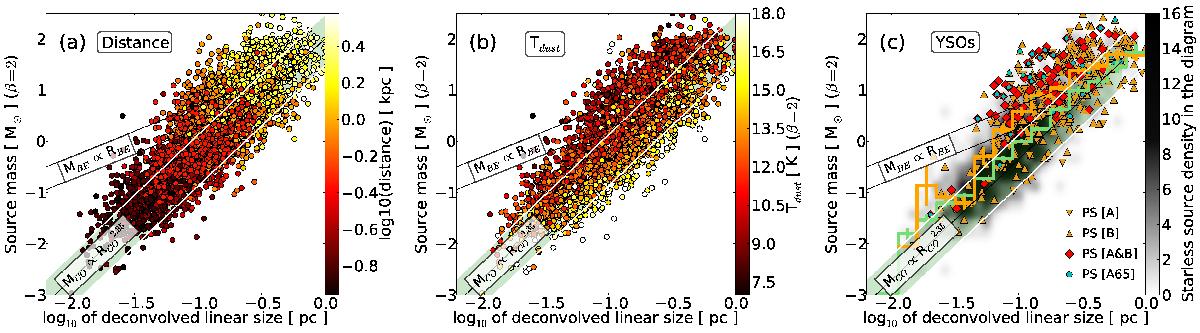
Mass–size diagrams for the galactic sources of our catalogue with distance flags 1 or 2. The masses are derived as explained in Sect. 4.2 and the sizes are the deconvolved linear sizes derived from the getsources output for the column density map. As a comparison, the pale green band and white lines show the correlation observed for CO clumps (Elmegreen & Falgarone 1996). The two solid black lines indicate the loci for critical isothermal Bonnor-Ebert spheres at T = 7 K (lower line) and T = 20 K (upper line). The colour scale indicates the distance of sources in frame a), and the dust colour temperature of sources in frame b). Frame c) compares the location of protostellar sources (points) to starless sources (grey scale). Orange triangles: protostellar sources with flag [1] from method A (tip-down) or B (tip-up). Red diamonds: protostellar sources from both methods (flag [2]). Blue circles: protostellar sources with AKARI 65 μm counterpart. The bin-averaged mass curves for starless and protostellar sources are overplotted in green and orange, respectively. The vertical bars are the standard deviations for each bin average.
Current usage metrics show cumulative count of Article Views (full-text article views including HTML views, PDF and ePub downloads, according to the available data) and Abstracts Views on Vision4Press platform.
Data correspond to usage on the plateform after 2015. The current usage metrics is available 48-96 hours after online publication and is updated daily on week days.
Initial download of the metrics may take a while.