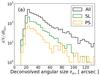
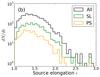
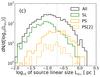
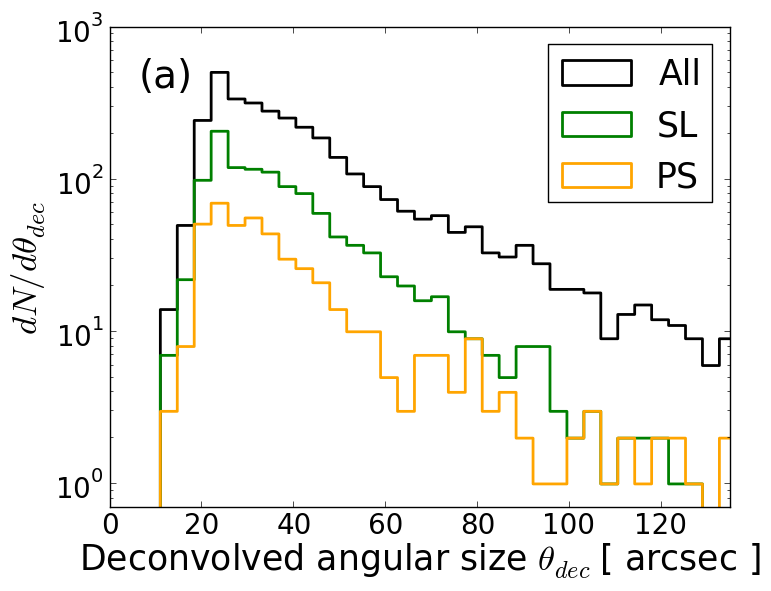
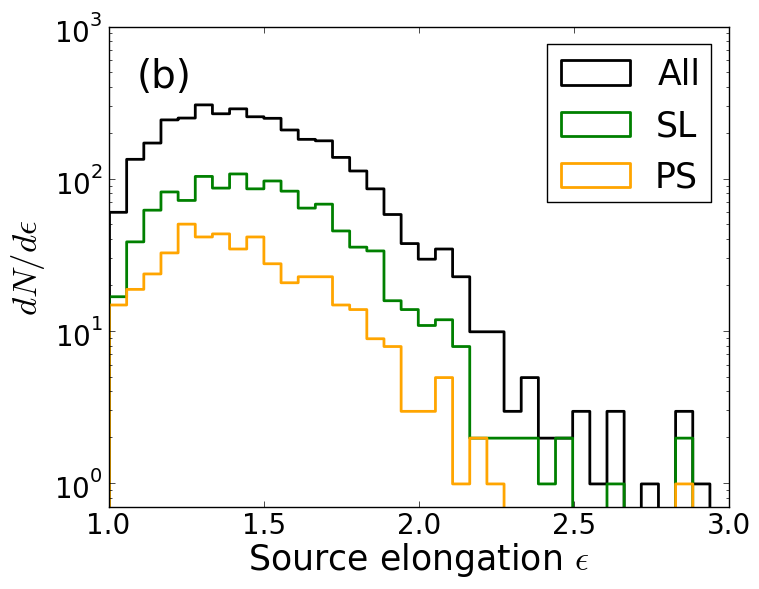
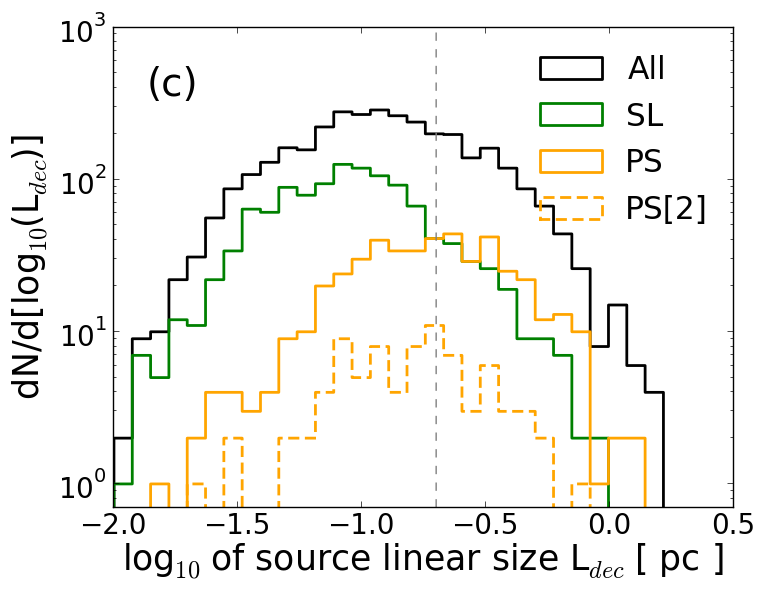
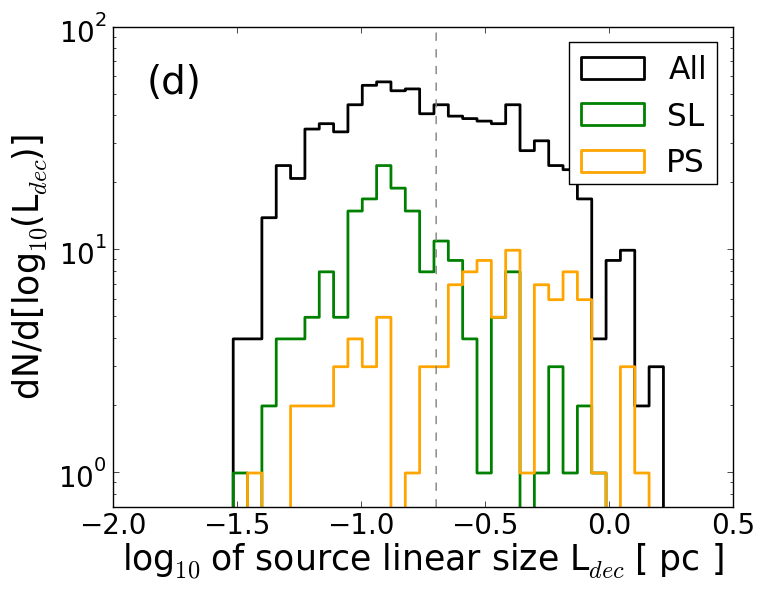
Fig. 11
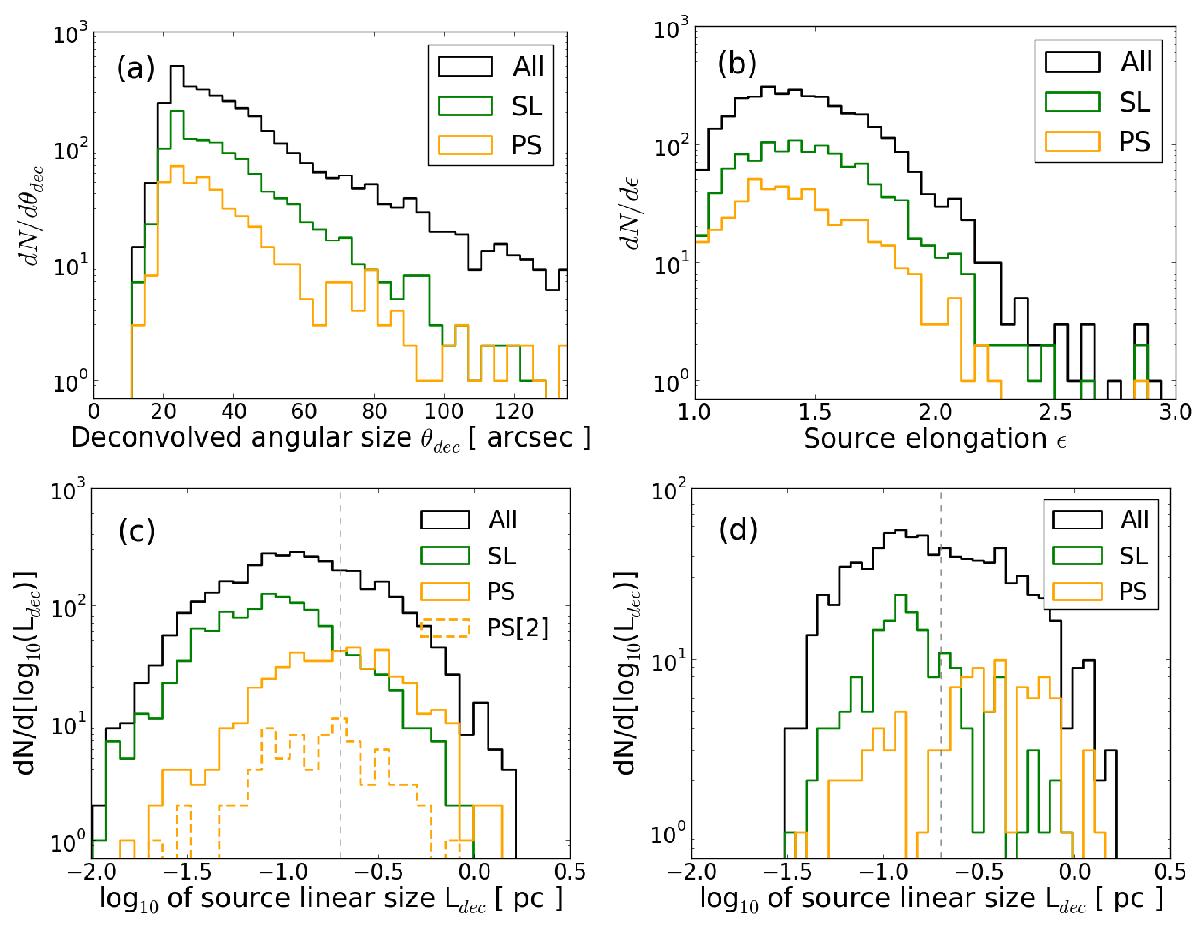
a) Distributions of the angular deconvolved sizes of all galactic sources with distance flags [1] or [2]. The black histogram is for all galactic sources (All), green for starless sources (SL), and orange for protostellar sources (PS, flags [1] and [2]). b) Distribution of the elongation of galactic sources. c) Distributions of the linear deconvolved sizes of galactic sources. The dashed histogram is for protostellar sources with a classification flag of [2]. d) Same as frame c) after selecting sources with angular sizes larger than 60′′ for both major and minor axes. The vertical dashed lines show the size of 0.2 pc.

Current usage metrics show cumulative count of Article Views (full-text article views including HTML views, PDF and ePub downloads, according to the available data) and Abstracts Views on Vision4Press platform.
Data correspond to usage on the plateform after 2015. The current usage metrics is available 48-96 hours after online publication and is updated daily on week days.
Initial download of the metrics may take a while.