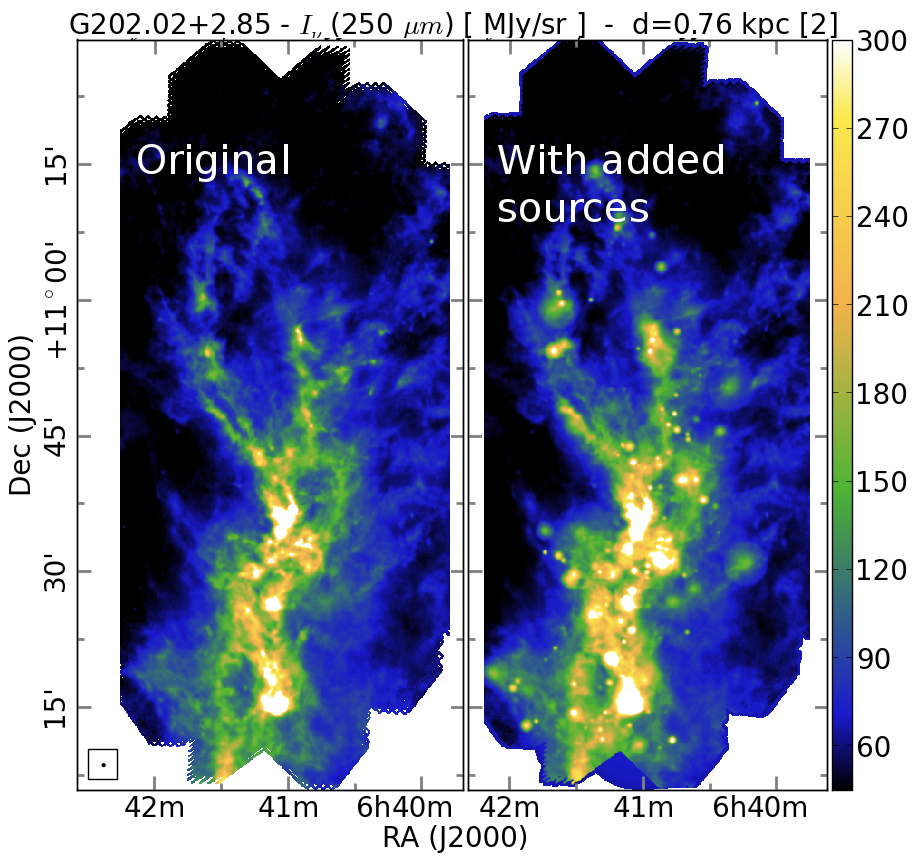
Fig. 10
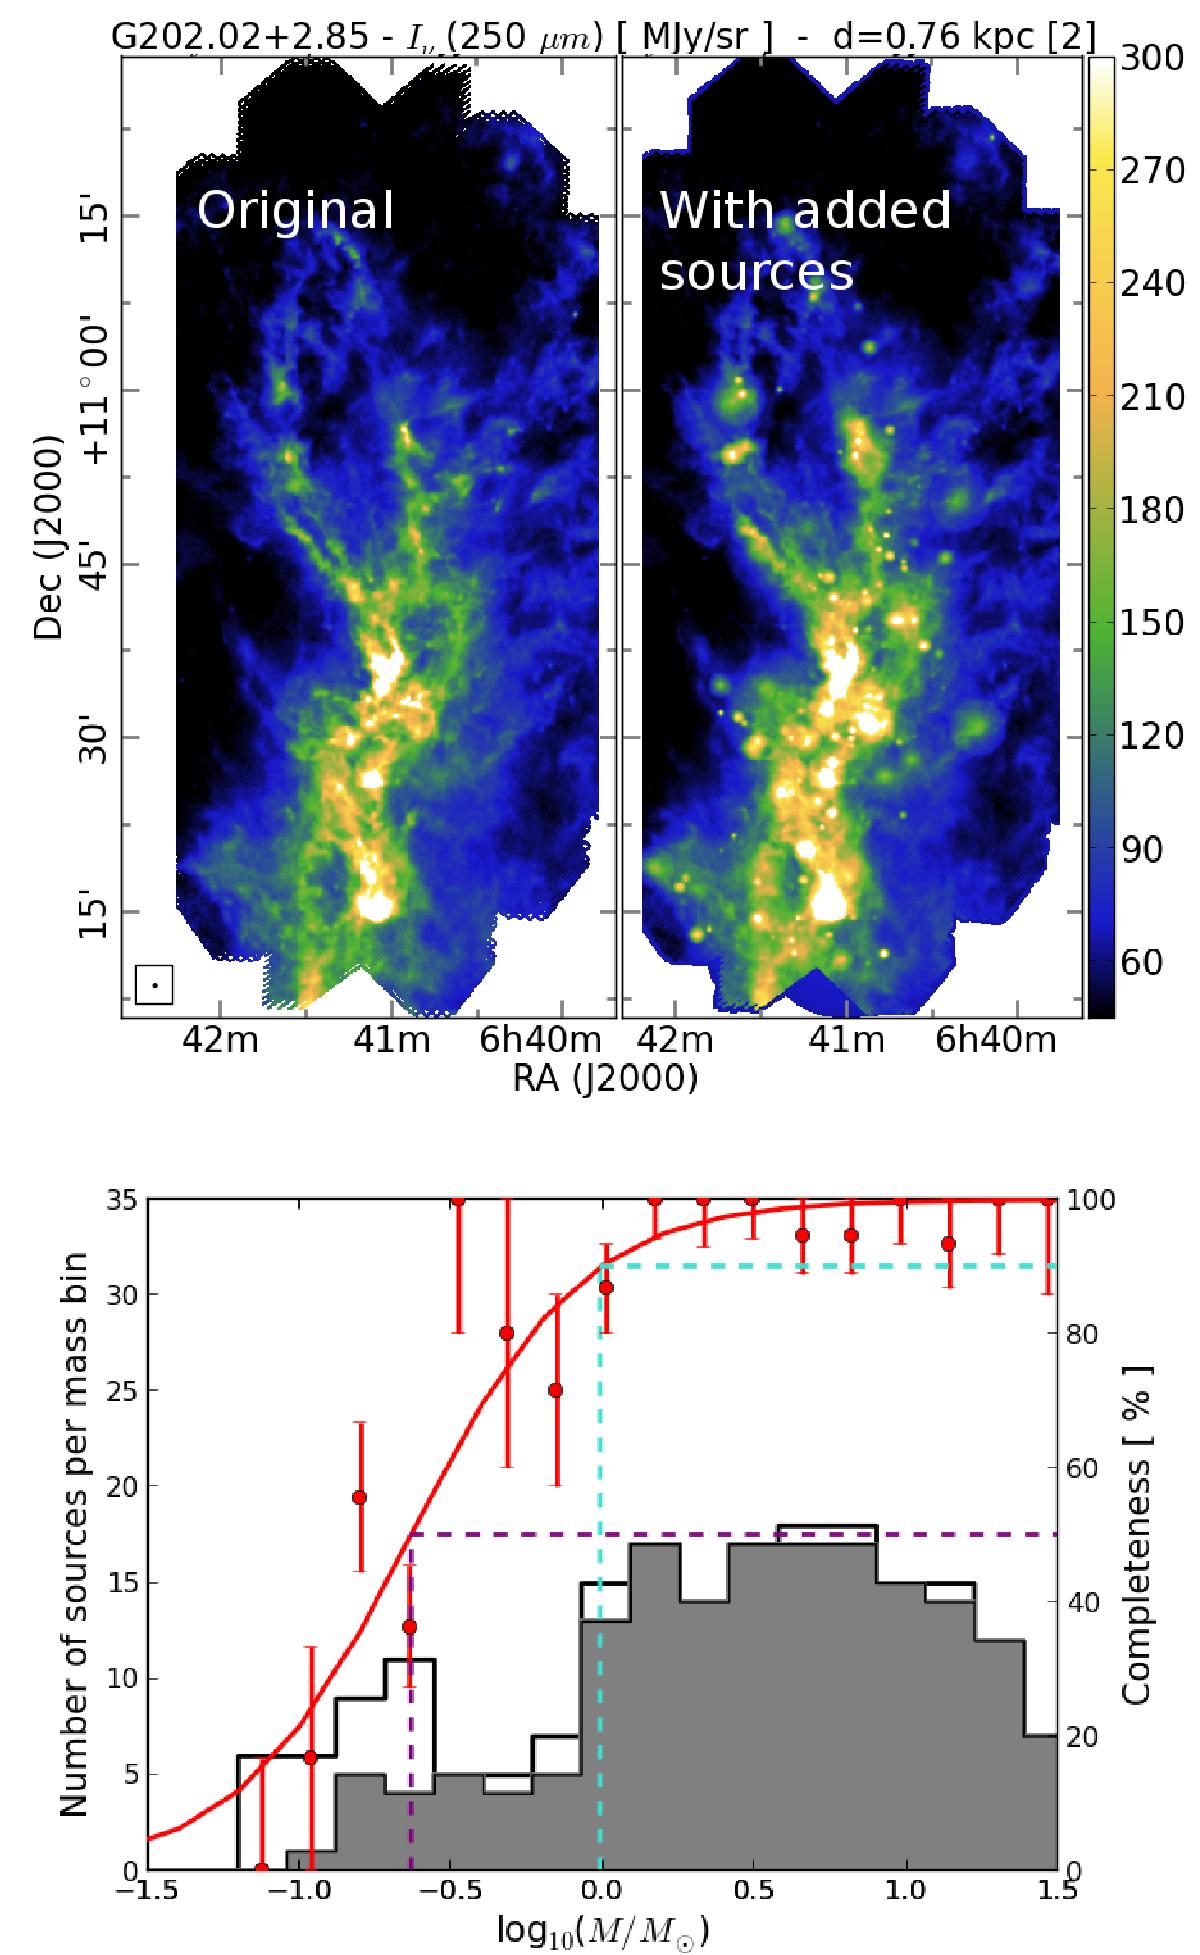
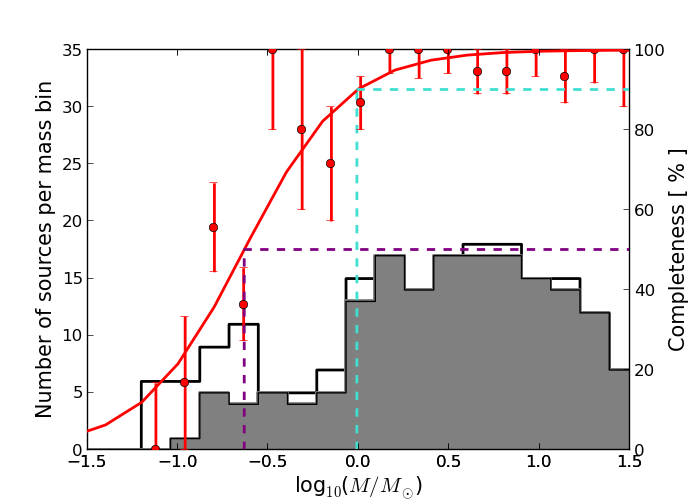
Example of completeness analysis in the case of G202.02+2.85. Upper panel: surface brightness map of G202.02+2.85 in the 250 μm band for the true observations (left) and after adding isothermal Bonnor-Ebert sources (right). Lower panel: the black line histogram shows the mass spectrum of the added Bonnor-Ebert sources. The grey histogram represents the mass spectrum of the sources detected by getsources. The red points are the bin-by-bin ratio of the two histograms with statistical error bars defined by 1/![]() with N the number of injected sources. The red solid line is a tanh fit of the red points. The blue and purple dashed lines emphasise the completeness values at 90% and 50%, respectively.
with N the number of injected sources. The red solid line is a tanh fit of the red points. The blue and purple dashed lines emphasise the completeness values at 90% and 50%, respectively.
Current usage metrics show cumulative count of Article Views (full-text article views including HTML views, PDF and ePub downloads, according to the available data) and Abstracts Views on Vision4Press platform.
Data correspond to usage on the plateform after 2015. The current usage metrics is available 48-96 hours after online publication and is updated daily on week days.
Initial download of the metrics may take a while.