| Issue |
A&A
Volume 583, November 2015
|
|
|---|---|---|
| Article Number | L5 | |
| Number of page(s) | 4 | |
| Section | Letters | |
| DOI | https://doi.org/10.1051/0004-6361/201527434 | |
| Published online | 04 November 2015 | |
Reinforcing the link between the double red clump and the X-shaped bulge of the Milky Way⋆
1 European Southern Observatory, Ave. Alonso de Cordova 3107, Casilla 19, 19001 Santiago Chile
e-mail: This email address is being protected from spambots. You need JavaScript enabled to view it.
2 Institute for Astronomy, University of Edinburgh, Royal Observatory, Blackford Hill, Edinburgh, EH9 3HJ, UK
3 Instituto de Astrofísica, Facultad de Física, Pontificia Universidad Católica de Chile, Av. Vicuña Mackenna 4860, Santiago 22, Chile
4 Instituto Milenio de Astrofísica, Camino El Observatorio 1515, Las Condes, Santiago, Chile
5 Jeremiah Horrocks Institute, University of Central Lancashire, Preston PR1 2HE, UK
6 Unidad de Astronomía, Facultad Cs. Básicas, Universidad de Antofagasta, Avda. U. de Antofagasta 02800, Antofagasta, Chile
7 European Southern Observatory, Karl-Schwarzschild Strasse 2, 85748 Garching, Germany
8 Departamento de Ciencias Físicas, Universidad Andrés Bello, República 220, Santiago, Chile
9 Vatican Observatory, 00120 Vatican City State, Italy
Received: 23 September 2015
Accepted: 19 October 2015
Abstract
The finding of a double red clump in the luminosity function of the Milky Way bulge has been interpreted as evidence for an X-shaped structure. Recently, an alternative explanation has been suggested, where the double red clump is an effect of multiple stellar populations in a classical spheroid. In this Letter we provide an observational assessment of this scenario and show that it is not consistent with the behaviour of the red clump across different lines of sight, particularly at high distances from the Galactic plane. Instead, we confirm that the shape of the red clump magnitude distribution closely follows the distance distribution expected for an X-shaped bulge at critical Galactic latitudes. We also emphasize some key observational properties of the bulge red clump that should not be neglected in the search for alternative scenarios.
Key words: Galaxy: bulge / Galaxy: structure
Based on observations taken within the ESO VISTA Public Survey VVV, Programme ID 179.B-2002.
© ESO, 2015
1. Introduction
Understanding galaxy formation and evolution is one of the fundamental goals of modern astronomical research. In particular, modern simulations reveal that the overall shape of galaxy bulges and the properties of their stars can hold the fingerprints of the role that different processes, such as dynamical instabilities, hierarchical merging, and dissipative collapse, played in the assembly history of the entire host galaxy.
There are two main ideas in how bulges form: the merger-driven bulge scenario and the secular evolution scenario. Bulges can be formed during the early stages of the galaxy, dominated by violent and rapid processes of hierarchical merging of sub-clumps of dark-matter carrying baryons and gas (e.g. Brook et al. 2011). These processes give rise to a spheroidal structure that is dominated by old stars and is known in the literature as a classical bulge (see Brooks & Christensen 2016, for a recent review). On the other hand, the bulge structure in the secular evolution scenario is naturally born from the dynamical evolution of a stellar disc (e.g. Combes & Sanders 1981; Athanassoula 2005). The stellar bar in the inner regions of a galaxy suffers from so-called buckling instabilities that cause it to thicken in the vertical direction. This produces the so-called boxy-peanut (B/P) bulges, which earned this name because their shape is boxy, like a peanut, or even like an X when seen in edge-on projection (see Laurikainen & Salo 2016, for a recent review)1.
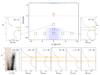 |
Fig. 1 Luminosity function of the bulge RGB and RC, in several fields. The large box in the middle shows the bulge area covered by the VVV survey, with the seven fields for which we show the RGB luminosity function. We also show as a shaded blue rectangle the region where the double RC is visible (| b | > 5°| l | < 4°). The shading is finer where the double RC is clearly evident and becomes wider when one of the two RCs becomes significantly weaker than the other. In the bottom left corner we show the CMD of the field at (+ 8°,−8°) as an example of the colour selection that we applied to exclude the main sequence of the foreground disc. Orange horizontal lines mark the magnitude of the two RCs in the five fields at b = −8° shown in the bottom panels. Green horizontal lines mark the magnitude of the two RCs at b = −6°, shown at the top right. Only one RC is visible at b = −4° (Baade’s Window), shown at the top left. |
In response to this, attempts to link the formation of the Galactic bulge to these processes have increased considerably during the past years. In particular, the structure of the bulge has been mapped extensively thanks to the large coverage of recent near-IR surveys of the inner Galaxy. These studies are often based on the construction of the luminosity function of the bulge towards a given line of sight, where the red clump (RC) feature can be identified, its mean magnitude measured, and used as a distance indicator (e.g. Stanek & Garnavich 1998). Following the discovery of a split of the RC along the bulge’s minor axis by Zoccali (2010) and McWilliam et al. (2010), McWilliam & Zoccali (2010), Nataf et al. (2010), and Saito et al. (2011) used this technique to provide a wide mapping of the double RC feature in the bulge luminosity function. These studies concluded that the bright (bRC) and faint (fRC) red clumps are the consequence of two over-densities of stars located at different distances, namely the two southern arms of an X-shaped structure that both cross the lines of sight. Wegg & Gerhard (2013) modelled the distribution of RC stars, observed in the VISTA Variables in the Via Lactea (VVV) ESO public survey and provided the complete mapping of what is now referred to as the X-shaped bulge of the Milky Way.
Recently, Lee et al. (2015) presented a different interpretation for the split RC in which a classical bulge with an additional population enriched in helium co-exists with a bar. Within this hypothesis, the authors assigned all the bar-like properties to the Milky Way bar component, which has not undergone a buckling instability and is thus restricted to low Galactic latitudes. The double RC is then not caused by the X-shape of the bar, but instead is the consequence of a massive classical bulge with a significant fraction of stars enriched in helium. In this Letter, we challenge the validity of this scenario based on the observational properties of the RC in some specific lines of sight.
2. Observational requirements for interpreting the double red clump
In this section we list four of the basic observed characteristics of the RC magnitude distribution of the Galactic bulge. Any physical interpretation of the double RC must satisfy, as a minimum requirement, the following purely observational properties:
-
1.
At Galactic latitudes| b | < 5°, a single RC is observed (Babusiaux & Gilmore 2005; Rattenbury et al. 2007; Cao et al. 2013; Gonzalez et al. 2013). An additional much fainter component has also been detected2. The mean magnitude of the RC varies by 1.0 mag from l = + 10° (where Ks0(RC) = 12.4) to l = −10° (where Ks0(RC) = 13.4).
-
2.
At Galactic latitudes | b | > 5°, several studies have shown that the double RC is seen only close to the minor axis of the bulge (−4°<l< + 4°). The magnitude separation between the two RCs increases with increasing Galactic latitude from 0.4 mag at b = −5° to 0.7 mag at b = −10° (McWilliam & Zoccali 2010; Saito et al. 2011; Wegg & Gerhard 2013).
-
3.
At a fixed Galactic latitude, the fRC becomes gradually less populated towards lines of sight at increasing longitudes, until only the bRC can be detected. The opposite effect is observed towards negative Galactic longitudes (McWilliam & Zoccali 2010; Saito et al. 2011).
-
4.
Everywhere, the variation of the RC magnitude as well as the magnitude difference between the two RCs, where there are two, is independent of the observational band.
Figure 1 shows the luminosity function of a set of bulge fields located at a constant latitude strip at b = −8° and for two additional fields along the minor axis to illustrate the points listed above. Each field is 1° × 1° in size. To construct the luminosity functions we used the VISTA Variables in the Via Lactea J, Ks PSF photometric catalogues (Alonso-Garcia et al., in prep.) corrected for reddening using the BEAM calculator (Gonzalez et al. 2012).
3. Multiple population spheroid and bar component scenario
Lee et al. (2015) presented a scenario where the double RC is the consequence of a classical spheroid with two stellar populations, one of which is significantly enhanced in helium. Specifically, a first population, called G1, has a skewed metallicity distribution in the range −0.75 < [Fe/H] < + 0.05 and a standard helium enrichment parameter, thus populating the faint RC. A second, super-helium-rich generation of stars (G2), with −0.55 < [Fe/H] < + 0.25 and Y = 0.39 populates the bright RC. Lee et al. (2015) assumed that the global metallicity distribution function peaks at [Fe/H] = −0.1, but the two populations have a mean metallicity difference of Δ [Fe/H] G2−G1 = 0.2 and ages of 12 Gyr for G1 and 10 Gyr for G2. In addition to this classical spheroid component, they included a bar population similar to G1, but with an age of 10 Gyr and a narrow metallicity distribution peaked at [Fe/H] = +0.15, with σ[Fe/H] = 0.1. They adopted a population ratio between the bar and the CB components of 2:1 at low latitudes, comparable to a population ratio at |b| ~ 5.5°, and fully dominated by the CB component at higher latitudes. Lee et al. (2015) did not explicitly state what they refer to as low and high latitudes, therefore we assumed for our analysis three Galactic latitude strips at b = −3.0°, −5.5°, and −8.5°.
With this scenario, Lee et al. (2015) claimed to be able to reproduce all the key observations of the bulge. They found a magnitude difference of 0.5 mag between the faint and bright RC, with negligible differences in colour. The double RC would not be detected in the metal-poor stars since the metallicity is required to be [Fe/H] > −0.4 for the super-helium-rich G2 to form and remain in the bRC. The latitude-longitude dependency of the double RC is then explained by the different contributions of the CB and a bar component with a suitable position angle (cf. their Fig. 4). The RC of the bar population would be suitably placed between the faint and bright RC of the CB component. Thus, since the bar population would become less dominant at increasing |b| and vanish at high latitudes, the double RC would become more prominent and the magnitude difference between fRC and bRC would increase with increasing latitude |b|. On the other hand, at intermediate latitudes (| b | = 5.5°), the effect of the bar position angle would cause the bulge RC to overlap with one of the two RCs of the spheoroid, so that the other, largely outnumbered, would not be detected. At positive longitude the bar is closer, hence its RC would overlap with the spheroid bRC, and vice versa at negative longitudes.
4. Testing the scenario with the observed double red clump of the bulge
In this section we test the multiple population classical bulge (MCB) scenario proposed by Lee et al. (2015) by comparing it to some key observations that, in our opinion, were not properly taken into account in their paper. In particular, we focus on observations where the points (P1, P2, P3, and P4) listed in Sect. 2 can be reliably tested. Figure 2 shows the bulge luminosity functions at Galactic longitudes l = −2°, 0°, and + 2° at latitudes b = −3.0°, −5.5°, and −8.5°. For each line of sight, the underlying red giant branch was subtracted using an exponential function following the prescriptions of Nataf et al. (2010).
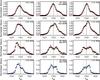 |
Fig. 2 RC magnitude distributions for lines of sight for Galactic longitudes l = −2°, 0°, and +2° and Galactic latitudes b = −3.0°, −5.5°, and −8.5°. The bottom panel shows the simulated magnitudes derived from the distance distribution of particles of the B/P bulge model from Ness et al. (2014) at the corresponding lines of sight for b = −8.5°. All the distributions at the same Galactic latitude have been normalized by the maximum of the central distribution (l = 0°). The solid black line shows the mean of the RC distribution at (l,b) = (0°,−3.0°) and the dashed lines show the maximum separation of the two RCs at (l,b) = (0°,−8.5°). |
In principle, P1 can be satisfied within the MCB scenario of Lee et al. (2015) by placing a population dominated by the bar in these inner regions. P4 can also be satisfied based on the negligible photometric bandpass dependency of the RC magnitude of G1 and G2 (S. Cassisi, priv. comm.). We note, however, that the mean magnitude changes of the single RC, induced by the bar position angle, should remain the same at all latitudes. The upper panels of Fig. 2 show that the single RC observed at low latitudes has a mean magnitude variation of ΔKs = ±0.2 when moving from l = +2° to l = −2°. According to Lee et al. (2015), the bulge should be dominated by the bar at these latitudes, therefore this is the maximum possible variation of the bar RC that is due to the bar position angle. At higher |b|, the magnitude variation of the bar RC invoked to erase the signature of the double RC should not exceed 0.2 mag. Furthermore, at higher latitudes (| b | = 8.5°), no variations should be observed between the RC magnitude distribution at positive and negative longitudes, as this is where the effect of the bar would be negligible, and we would only see the MCB. In contrast, it is not possible to explain the RC magnitude variations observed at b = −5.5° as due to the bar RC shifts seen at b = −3.0°. The observed changes in the RC distributions become even more dramatic at b = −8.5°. Here, not only is the separation between the fRC and bRC already 0.7 mag at l = 0°, as expected from P2, but the bRC at l = +2° also becomes even more dominant with respect to the fRC, although no bar should be present here in the scenario of Lee et al. (2015). A Galactic latitude of b = −8.5° corresponds to a height of ~1.2 kpc from the plane for a population located at 8 kpc from the Sun. Certainly, for the bar population to be present at such large heights from the plane, a buckling instability process would be required. Similarly, the fact that the fRC (bRC) becomes less populated with increasing (decreasing) longitude, to the point where only one of the RCs is visible as described in P3 (Fig. 1), firmly argues against the MCB scenario. The only way to explain P3 within the scenario of Lee et al. (2015) would be to impose a rather unrealistic spatial distribution for populations G1 and G2 where only one of them is present at each side of the MCB.
On the other hand, the B/P nature of the bulge is able to naturally explain the observed changes in the RC seen in Figs. 1 and 2. To judge the plausibility of such a scenario, it is important to emphasize that the double RC was discovered and later mapped by Saito et al. (2011) using 2MASS photometry. As a result of the high incompleteness of 2MASS in the innermost regions (|b| < 3°), early studies did not properly normalize the star counts in the inner and outer bulge. Because of this, the first (qualitative) estimates of the density contrast of the X-shape were overestimated. When VVV photometry became available, Wegg & Gerhard (2013) performed a 3D reconstruction of the shape of the whole bulge, using a correct density normalization. From their results it was clear that the contrast of the X-shaped structure in the outer bulge is very similar to that of external galaxies with B/P bulges, of which several examples are available in the nearby universe (Laurikainen & Salo 2016). In fact, bars seen edge-on have a boxy shape, and most of them also have a peanut shape, which is due to the natural instability of bars that produces some bending and buckling of the bar. It is then important to realize that the X-shape claimed to be present in the Milky Way is not a particularly exotic hypothesis, but a rather common feature in barred galaxies.
To support the latter statement, we compare here the observed RC magnitude distributions with the output of a B/P bulge simulation from Ness et al. (2014). We note that we did not fine-tune the simulation, which was not specifically made to reproduce the Milky Way properties. We use it here only because it has a pure B/P bulge and thus its line-of-sight distance distributions provide the ideal test for interpreting the RC observations. We scaled the model size to be comparable to the B/P of the Milky Way using a factor of 1.2 as described in Ness et al. (2014). We transformed the coordinates of the model to place the Sun at 8 kpc from the centre of the galaxy and the bar to have a position angle of 27° with respect to the Sun-Galactic centre line-of-sight (Rattenbury et al. 2007; Wegg & Gerhard 2013). We converted the line-of-sight distance to every star particle of the model to an observed magnitude by adopting an absolute magnitude for the RC of M(Ks) = −1.55 mag (Gonzalez et al. 2011). The magnitude distribution of stars towards each line of sight was then convolved with a Gaussian FWHM of 0.21 mag to account for the observational effects of the bulge RC population (Gerhard & Martinez-Valpuesta 2012). The resulting simulated RC magnitudes for b = −8.5° are shown in the bottom panel of Fig. 2. The B/P model nicely reproduces the double RC shape and variations seen at higher latitudes. The fact that these magnitude distributions were constructed directly from their spatial distribution confirms that the RC magnitude closely follows the shape of the Milky Way bulge structure. The resemblance with the observed distribution at b = −8.5° certainly confirms the B/P bulge origin for the double RC.
5. Concluding remarks
We have provided a list of the observational properties of the double RC of the Milky Way bulge that must be satisfied when attempting to interpret its origin. We showed that these basic properties disagree with the scenario proposed by Lee et al. (2015), where the double RC originates from a MCB with two generations of stars each of them with a different helium enrichment, but instead they are a natural consequence of the B/P shape of the Milky Way bulge. The main reasons that support our conclusion is that a B/P bulge, which is very common in external galaxies, is able to consistently explain the presence (and absence) of a double RC where it is actually observed without fine-tuning any parameters. The bar orientation angle that best reproduces the observations (27° according to Wegg & Gerhard 2013) is fully compatible with previous measurements (e.g. Rattenbury et al. 2007). In contrast, the work of Lee et al. (2015) is based on the search for a mechanism able to produce a double RC everywhere in the Galactic bulge. This obviously needs another, specifically tailored mechanism to erase the double RC everywhere except in a narrow range of longitudes in the outer bulge. Such a task requires fine-tuning both the iron and helium distribution of G1 and G2 and of a suitable bar orientation angle and density distribution. Yet, as we have demonstrated, it still cannot explain the disappearance of the double RC away from the minor axis (in longitude) in the outer bulge. Instead, we showed that the line-of-sight distance distribution of a simulated galaxy with a B/P bulge naturally follows the observed RC magnitude distribution of the Milky Way bulge at high distances from the plane.
We do consider that including stellar population variations such as were presented in Lee et al. (2015) are important to determine the precision of the RC as a distance indicator. The effect of stellar populations is currently considered to be minimal in morphological studies of the Milky Way bulge. Providing a set of corrections can help improving our current map of the B/P bulge structure of the Milky Way even further.
We note that attempting to classify observed bulges as the result of only one of these two scenarios is perhaps a too simplistic view. Recent observations of main-sequence galaxies at z ~ 2 show that the migration and central coalescence of massive star-forming clumps (Immeli et al. 2004; Bournaud et al. 2009) may develop into a global violent disc instability and also lead to the formation of compact bulges through dissipation (Dekel & Burkert 2014).
This additional bump seen in the luminosity function is found at much fainter magnitudes (Ks0 ~ 14.3) and it does not affect the conclusions of this work or those from Lee et al. (2015). Its origin has been linked to the bulge red giant branch bump (Nataf et al. 2010) or the background stellar disc (Gonzalez et al. 2011), however, this discussion is beyond the scope of this Letter.
Acknowledgments
We thank the anonymous referee for useful comments. We warmly thank Andy McWilliam for his thoughtful comments and Santi Cassisi for useful discussions about the RC magnitude variation as a function of helium abundance. M.Z. acknowledges funding from the BASAL CATA through grant PFB-06, and the Chilean Ministry of Economy through ICM grant to the Millennium Institute of Astrophysics and the support by Proyecto Fondecyt Regular 1150345. V.P.D. is supported by STFC Consolidated grant # ST/J001341/1. J.A.-G. acknowledges support by the FIC-R Fund, allocated to the project 30321072. The simulation used in this study was run at the High Performance Computer Facility of the University of Central Lancashire.
References
- Athanassoula, E. 2005, MNRAS, 358, 1477 [NASA ADS] [CrossRef] [Google Scholar]
- Babusiaux, C., & Gilmore, G. 2005, MNRAS, 358, 1309 [NASA ADS] [CrossRef] [Google Scholar]
- Bournaud, F., Elmegreen, B. G., & Martig, M. 2009, ApJ, 707, L1 [NASA ADS] [CrossRef] [Google Scholar]
- Brook, C. B., Governato, F., Roškar, R., et al. 2011, MNRAS, 415, 1051 [NASA ADS] [CrossRef] [Google Scholar]
- Brooks, A., & Christensen, C. 2016, in Galactic Bulges (Springer International Publishing), Astrophys. Space Sci. Libr., 418, 317 [NASA ADS] [CrossRef] [Google Scholar]
- Cao, L., Mao, S., Nataf, D., Rattenbury, N. J., & Gould, A. 2013, MNRAS, 434, 595 [NASA ADS] [CrossRef] [Google Scholar]
- Combes, F., & Sanders, R. H. 1981, A&A, 96, 164 [NASA ADS] [Google Scholar]
- Dekel, A., & Burkert, A. 2014, MNRAS, 438, 1870 [NASA ADS] [CrossRef] [Google Scholar]
- Gerhard, O., & Martinez-Valpuesta, I. 2012, ApJ, 744, L8 [NASA ADS] [CrossRef] [Google Scholar]
- Gonzalez, O. A., Rejkuba, M., Minniti, D., et al. 2011, A&A, 534, L14 [NASA ADS] [CrossRef] [EDP Sciences] [Google Scholar]
- Gonzalez, O. A., Rejkuba, M., Zoccali, M., et al. 2012, A&A, 543, A13 [NASA ADS] [CrossRef] [EDP Sciences] [Google Scholar]
- Gonzalez, O. A., Rejkuba, M., Zoccali, M., et al. 2013, A&A, 552, A110 [NASA ADS] [CrossRef] [EDP Sciences] [Google Scholar]
- Immeli, A., Samland, M., Gerhard, O., & Westera, P. 2004, A&A, 413, 547 [NASA ADS] [CrossRef] [EDP Sciences] [Google Scholar]
- Laurikainen, E., & Salo, H. 2016, in Galactic Bulges (Springer International Publishing), Astrophys. Space Sci. Libr., 418, 77 [NASA ADS] [CrossRef] [Google Scholar]
- Lee, Y.-W., Joo, S.-J., & Chung, C. 2015, MNRAS, 453, 3906 [NASA ADS] [CrossRef] [Google Scholar]
- McWilliam, A., & Zoccali, M. 2010, ApJ, 724, 1491 [NASA ADS] [CrossRef] [Google Scholar]
- McWilliam, A., Fulbright, J., & Rich, R. M. 2010, in IAU Symp. 265, eds. K. Cunha, M. Spite, & B. Barbuy, 279 [Google Scholar]
- Nataf, D. M., Udalski, A., Gould, A., Fouqué, P., & Stanek, K. Z. 2010, ApJ, 721, L28 [NASA ADS] [CrossRef] [Google Scholar]
- Ness, M., Debattista, V. P., Bensby, T., et al. 2014, ApJ, 787, L19 [NASA ADS] [CrossRef] [Google Scholar]
- Rattenbury, N. J., Mao, S., Sumi, T., & Smith, M. C. 2007, MNRAS, 378, 1064 [NASA ADS] [CrossRef] [Google Scholar]
- Saito, R. K., Zoccali, M., McWilliam, A., et al. 2011, AJ, 142, 76 [NASA ADS] [CrossRef] [Google Scholar]
- Stanek, K. Z., & Garnavich, P. M. 1998, ApJ, 503, L131 [NASA ADS] [CrossRef] [Google Scholar]
- Wegg, C., & Gerhard, O. 2013, MNRAS, 435, 1874 [Google Scholar]
- Zoccali, M. 2010, in IAU Symp. 265, eds. K. Cunha, M. Spite, & B. Barbuy, 271 [Google Scholar]
All Figures
|
Fig. 1 Luminosity function of the bulge RGB and RC, in several fields. The large box in the middle shows the bulge area covered by the VVV survey, with the seven fields for which we show the RGB luminosity function. We also show as a shaded blue rectangle the region where the double RC is visible (| b | > 5°| l | < 4°). The shading is finer where the double RC is clearly evident and becomes wider when one of the two RCs becomes significantly weaker than the other. In the bottom left corner we show the CMD of the field at (+ 8°,−8°) as an example of the colour selection that we applied to exclude the main sequence of the foreground disc. Orange horizontal lines mark the magnitude of the two RCs in the five fields at b = −8° shown in the bottom panels. Green horizontal lines mark the magnitude of the two RCs at b = −6°, shown at the top right. Only one RC is visible at b = −4° (Baade’s Window), shown at the top left. |
| In the text | |
|
Fig. 2 RC magnitude distributions for lines of sight for Galactic longitudes l = −2°, 0°, and +2° and Galactic latitudes b = −3.0°, −5.5°, and −8.5°. The bottom panel shows the simulated magnitudes derived from the distance distribution of particles of the B/P bulge model from Ness et al. (2014) at the corresponding lines of sight for b = −8.5°. All the distributions at the same Galactic latitude have been normalized by the maximum of the central distribution (l = 0°). The solid black line shows the mean of the RC distribution at (l,b) = (0°,−3.0°) and the dashed lines show the maximum separation of the two RCs at (l,b) = (0°,−8.5°). |
| In the text | |
Current usage metrics show cumulative count of Article Views (full-text article views including HTML views, PDF and ePub downloads, according to the available data) and Abstracts Views on Vision4Press platform.
Data correspond to usage on the plateform after 2015. The current usage metrics is available 48-96 hours after online publication and is updated daily on week days.
Initial download of the metrics may take a while.