Fig. 2
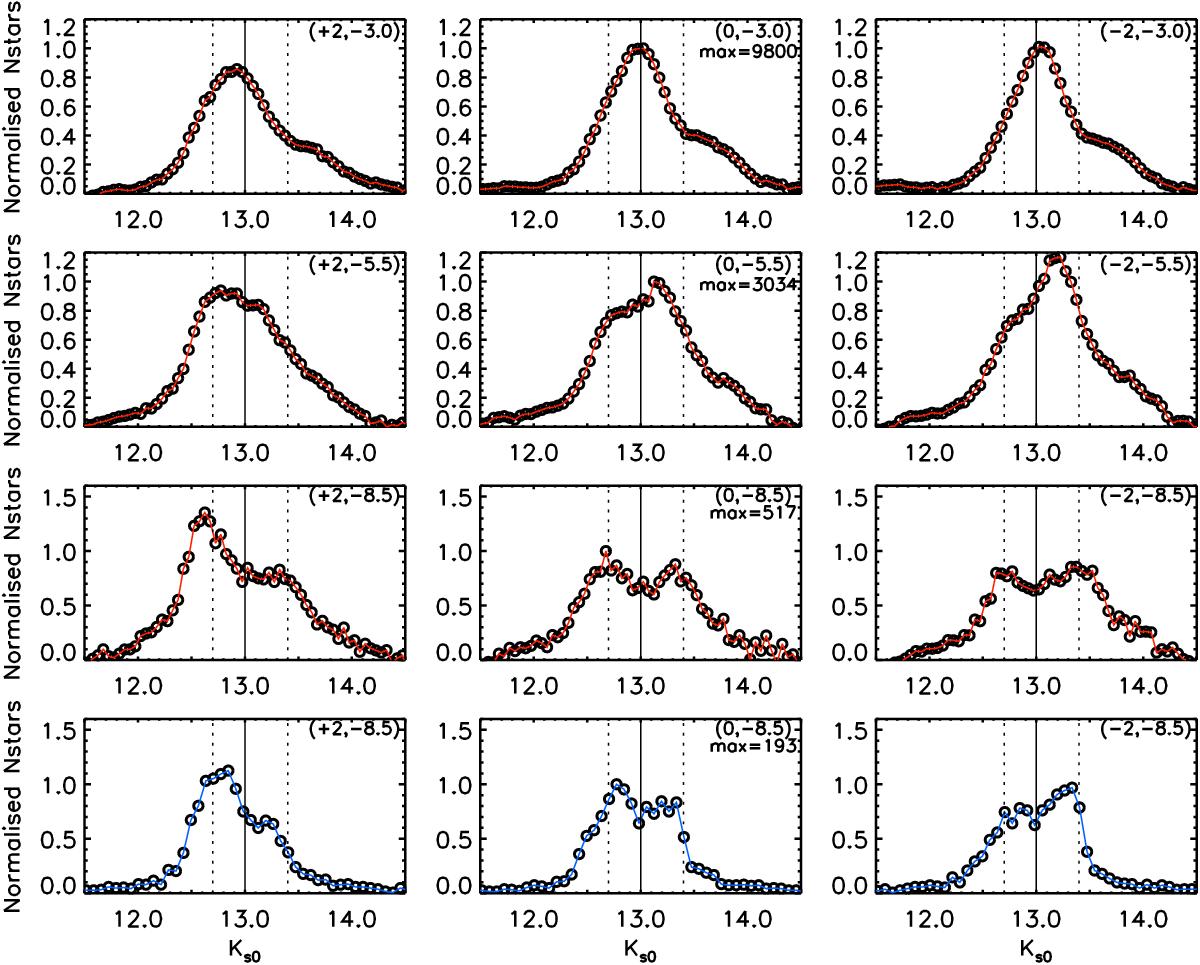
RC magnitude distributions for lines of sight for Galactic longitudes l = −2°, 0°, and +2° and Galactic latitudes b = −3.0°, −5.5°, and −8.5°. The bottom panel shows the simulated magnitudes derived from the distance distribution of particles of the B/P bulge model from Ness et al. (2014) at the corresponding lines of sight for b = −8.5°. All the distributions at the same Galactic latitude have been normalized by the maximum of the central distribution (l = 0°). The solid black line shows the mean of the RC distribution at (l,b) = (0°,−3.0°) and the dashed lines show the maximum separation of the two RCs at (l,b) = (0°,−8.5°).
Current usage metrics show cumulative count of Article Views (full-text article views including HTML views, PDF and ePub downloads, according to the available data) and Abstracts Views on Vision4Press platform.
Data correspond to usage on the plateform after 2015. The current usage metrics is available 48-96 hours after online publication and is updated daily on week days.
Initial download of the metrics may take a while.