Fig. 1
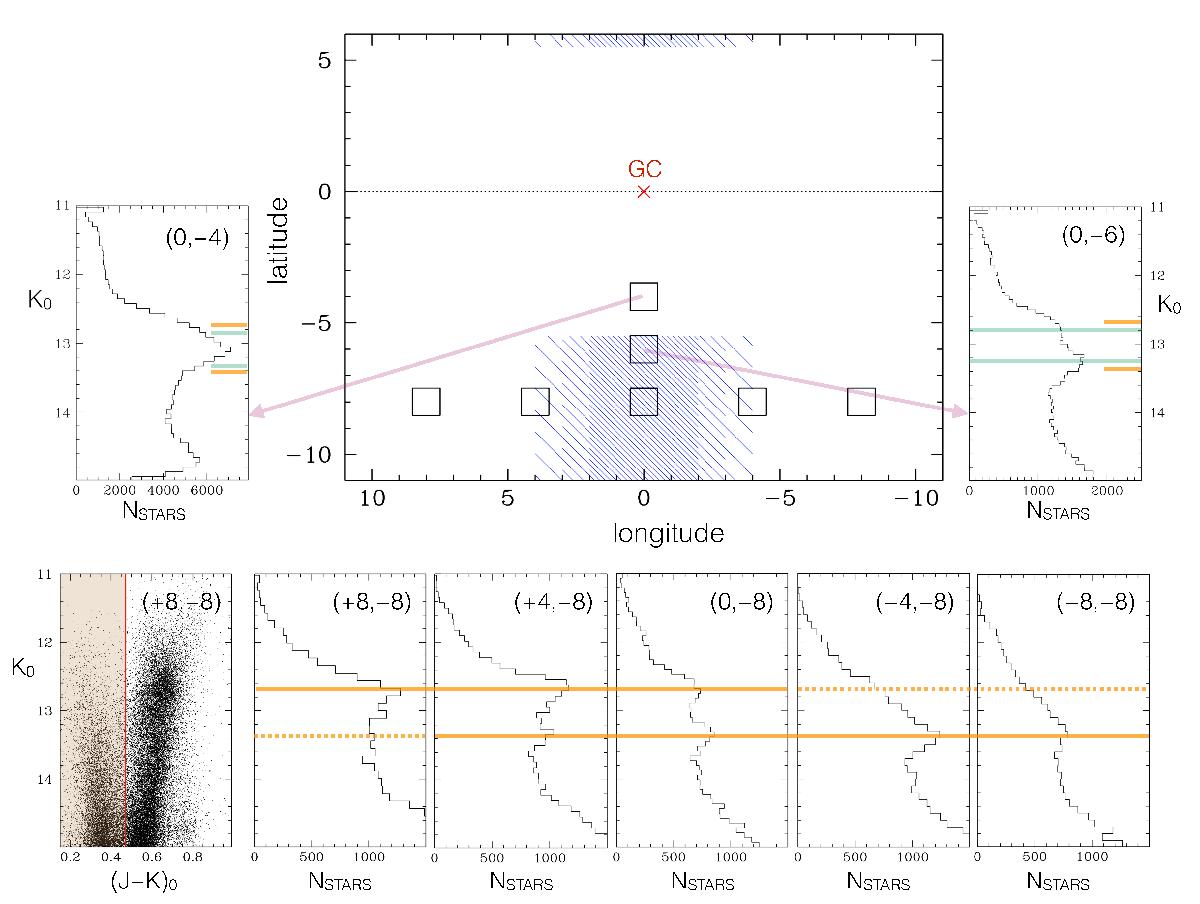
Luminosity function of the bulge RGB and RC, in several fields. The large box in the middle shows the bulge area covered by the VVV survey, with the seven fields for which we show the RGB luminosity function. We also show as a shaded blue rectangle the region where the double RC is visible (| b | > 5°| l | < 4°). The shading is finer where the double RC is clearly evident and becomes wider when one of the two RCs becomes significantly weaker than the other. In the bottom left corner we show the CMD of the field at (+ 8°,−8°) as an example of the colour selection that we applied to exclude the main sequence of the foreground disc. Orange horizontal lines mark the magnitude of the two RCs in the five fields at b = −8° shown in the bottom panels. Green horizontal lines mark the magnitude of the two RCs at b = −6°, shown at the top right. Only one RC is visible at b = −4° (Baade’s Window), shown at the top left.
Current usage metrics show cumulative count of Article Views (full-text article views including HTML views, PDF and ePub downloads, according to the available data) and Abstracts Views on Vision4Press platform.
Data correspond to usage on the plateform after 2015. The current usage metrics is available 48-96 hours after online publication and is updated daily on week days.
Initial download of the metrics may take a while.