| Issue |
A&A
Volume 583, November 2015
|
|
|---|---|---|
| Article Number | L3 | |
| Number of page(s) | 6 | |
| Section | Letters | |
| DOI | https://doi.org/10.1051/0004-6361/201526806 | |
| Published online | 02 November 2015 | |
Velocity and magnetic fields within 1000 AU of a massive YSO⋆
1
Max-Planck-Institut für Radioastronomie,
Auf dem Hügel 69,
53121
Bonn,
Germany
e-mail:
This email address is being protected from spambots. You need JavaScript enabled to view it.
2
JIVE, Joint Institute for VLBI in Europe,
Postbus 2, 7990 AA
Dwingeloo, The
Netherlands
3
INAF, Osservatorio Astrofisico di Arcetri, Largo E. Fermi
5, 50125
Firenze,
Italy
4
Department of Astrophysics/IMAPP, Radboud University
Nijmegen, PO Box
9010, 6500 GL
Nijmegen, The
Netherlands
5
Department of Earth and Space Sciences, Chalmers University of
Technology, Onsala Space Observatory, 439 92
Onsala,
Sweden
6 Dublin Institute for Advanced Studies, School of Cosmic
Physics, Astronomy & Astrophysics Section, 31 Fitzwilliam Place, Dublin 2,
Ireland
Received: 22 June 2015
Accepted: 16 September 2015
Abstract
Aims. We study the velocity and magnetic field morphology in the vicinity (<1000 AU) of a massive young stellar object (YSO) at very high spatial resolution (10–100 AU).
Methods. We performed milliarcsecond polarimetric observations of the strong CH3OH maser emission observed in the vicinity of an O-type YSO in G023.01−00.41. We combined this information with the velocity field of the CH3OH masing gas previously measured at the same angular resolution. We analyzed the velocity and magnetic fields in the reference system defined by the direction of the molecular outflow and the equatorial plane of the hot molecular core at its base, as recently observed on subarcsecond scales.
Results. We provide a first detailed picture of the gas dynamics and magnetic field configuration within a radius of 2000 AU of a massive YSO. We have been able to reproduce the magnetic field lines for the outer regions (>600 AU) of the molecular envelope, where the magnetic field orientation shows a smooth change with the maser cloudlets position (0.2° AU-1). Overall, the velocity field vectors accommodate the local magnetic field direction well, but still show an average misalignment of 30°. We interpret this finding as the contribution of a turbulent velocity field of about 3.5 km s-1, which would be responsible for breaking up the alignment between the velocity and magnetic field vectors. We do resolve different gas flows that develop both along the outflow axis and across the disk plane and that have an average speed of 7 km s-1. In the direction of the outflow axis, we establish a collimation of the gas flow at a distance of about 1000 AU from the disk plane. In the disk region, gas appears to stream outward along the disk plane for radii greater than 500–600 AU and inward for shorter radii.
Key words: ISM: kinematics and dynamics / masers / stars: formation / stars: individual: G023.01-00.41
Table 1 is available in electronic form at http://www.aanda.org
© ESO, 2015
1. Introduction
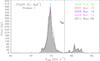 |
Fig. 1 Effelsberg total-power spectra toward G023.01−00.41, obtained from EVN observations at C-band, over 5 yr (from Sanna et al. 2010b, and current measurements). Observing dates are indicated in the top right of the plot. The dotted vertical line indicates the systemic velocity (Vsys) of the HMC, as inferred from CH3CN measurements. |
The role of magnetic fields in regulating the gas dynamics in the vicinity of growing, massive young stellar objects (YSOs) is still a matter of debate (e.g., Crutcher et al. 2010; Zhang et al. 2014). When simulating the build-up of massive protostars in the inner few 1000 AU, recent magneto-hydrodynamics (MHD) models have shown that magnetic fields may contribute significantly (1) to the degree of outflow collimation and (2) to stabilizing both Keplerian and sub-Keplerian disks against fragmentation (e.g., Seifried et al. 2011, 2012). In this context, Very Long Baseline Interferometry (VLBI) observations of maser emission, arising within a few 1000 AU of massive YSOs, allow us to determine both the velocity distribution and the magnetic field configuration close to the accreting protostar (e.g., Sanna et al. 2010a,b; Goddi et al. 2011; Moscadelli et al. 2011; Surcis et al. 2015). This gives us the unique opportunity to investigate, on a 10–100 AU scale, whether the magnetic field influences the gas kinematics.
G023.01−00.41 is a luminous star-forming region of about 4 × 10⁴L⊙ (Sanna et al. 2014), located at a trigonometric distance of 4.6 kpc (Brunthaler et al. 2009). This star-forming site harbors a flattened, hot molecular core (HMC) that is centered on an active site of strong maser and radio continuum emission (Sanna et al. 2010b, their Fig. 4). The kinematics of warm (200 K) gas in the inner 3000 AU, as traced with CH3CN and thermal CH3OH lines, shows the composition of two orthogonal velocity fields (Sanna et al. 2014, their Fig. 3). The velocity component that dominates on larger scales is aligned with the axis of a collimated bipolar outflow, which is traced progressively away from the HMC center with SiO and CO gas emission. Since the outflow emission is almost perpendicular to the line of sight, any associated disk should be seen edge-on, which makes this object an excellent target for studying the gas dynamics in the vicinity of an O-type YSO. Furthermore, the 3D gas kinematics revealed by the CH3OH masers shows a funnel-like morphology (Sanna et al. 2010b, their Fig. 6), which was best interpreted as the base of the outflow cavity (or the surface of a flared disk) with a size between 1000 AU and 2000 AU.
With this in mind, we decided to use the synergy between maser proper motions and polarization measurements, targeting the rich CH3OH maser spectrum observed in G023.01−00.41, to investigate whether magnetic fields may be actively driving the circumstellar gas motion around a massive YSO. That can be assessed by quantifying whether a correlation exists between the orientation of the velocity and polarization vectors locally, as measured for individual CH3OH masing cloudlets on scales of a few AU. To compare the magnetic field orientation with the velocity field previously measured by Sanna et al. (2010b), we conducted polarimetric observations of the 6.7 GHz CH3OH masers toward G023.01−00.41 with the European VLBI Network (EVN1).
2. Observations and calibration
We employed the EVN to observe in full polarization mode the 51−60 A+ CH3OH maser transition at the rest frequency of 6668.519 MHz toward G023.01−00.41. The observations were conducted under program ES067 on 2011 May 29. We made use of a single frequency setup to obtain both a high spectral sampling (0.98 kHz) of the maser lines and a bandwidth large enough (2 MHz) to accurately measure the continuum emission of the calibrator, J 2202+4216. This calibrator served both as a fringe finder and a polarization calibrator and was observed every 45 min to properly calibrate the polarization leakage. Since many maser features are expected to be linearly polarized at a level of about 1%, to reach a conservative detection above 5σ over half of the maser cloudlets previously detected (with peak intensities >3 Jy beam-1), we spent about 4.5 h on-source. The EVN data were processed with the SFXC software correlator (Keimpema et al. 2015) at the Joint Institute for VLBI in Europe by using an averaging time of 2 s. The single-dish spectrum of the CH3OH maser emission toward G023.01−00.41 is plotted in Fig. 1.
Data were reduced with the NRAO Astronomical Image Processing System (AIPS). We mapped the CH3OH maser distribution with a (robust 0) beam size of 11 mas × 4 mas, achieving a thermal noise of 5 mJy beam-1. To calibrate the systematic rotation of the linear polarization angle (χpol) in the EVN dataset, we compared the EVN measurement of χpol obtained on J 2202+4216, with two consecutive VLA polarimetric observations of the same calibrator2 bracketing our VLBI observations (on 2011 April 30 and 2012 February 3). The linear polarization angle of J 2202+4216 estimated with the VLA remained nearly constant with an average value of −31° ± 1° (position angles, e.g., χpol, are measured east of north, unless otherwise stated). The χpol measurements obtained with the EVN dataset are therefore affected by a systematic uncertainty of no more than a few degrees. The uncertainty of χpol due to thermal noise was obtained from the relative error of the polarization intensity measurement, following Wardle & Kronberg (1974). Details about the polarization calibration can be found in Surcis et al. (2013).
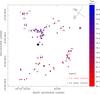 |
Fig. 2 Comparison of the velocity and polarization vectors across the CH3OH maser distribution in G023.01−00.41. We show the distribution of the 6.7 GHz maser cloudlets (dots) within a field of view of about 2000 AU, following Sanna et al. (2010b, their Fig. 6). Maser velocities along the line of sight are color-coded according to the righthand VLSR scale. Lines drawn on individual maser cloudlets indicate the orientation of the velocity (red) and polarization (black) fields locally, as obtained from VLBI measurements. For clarity, velocity vectors are only shown for cloudlets with an associated polarization vector. For isolated maser cloudlets, numbers correspond to the maser labels given in Table 1. The star marks the peak position of the high-excitation CH3OH thermal line detected by Sanna et al. (2014), which is the origin of the reference system (e.g., upper right corner) used in Figs. 3 and 4. |
3. Results
In the HMC center of G023.01−00.41, the milliarcsecond distribution of the 6.7 GHz CH3OH maser cloudlets has not changed over the five years covered by our observations. Although at some maser velocities the overall flux density has changed smoothly in time (Fig. 1), this variation affects the flux density of individual cloudlets, whereas the overall maser distribution is preserved. Among the eighty maser cloudlets detected by Sanna et al. (2010b), only about one third of them show linearly polarized emission, and their properties are listed in Table 1. Given that we know only the orientation of the linear polarization vectors (χpol), while their direction is undefined, we folded these values in the range −90° <χpol< 90°. The linear polarization fraction detected among the maser cloudlets ranges between 0.6% and 9.2% with an average value of 2%. The orientation of the linear polarization vectors is superposed on the CH3OH maser distribution in Fig. 2. For cloudlets with detected linear polarization, we also draw the direction (χvel) of the velocity vectors for comparison.
In Fig. 3, we study the distribution of the polarization vectors orientation with respect to the position of the CH3OH maser cloudlets. In Fig. 3a, we plot the minimum difference (χpol–χvel) between the orientation of the polarization and velocity vectors as a function of the sky position angle of each cloudlet. This position angle is measured east of north with respect to the HMC center (star symbol in Fig. 2), which is defined as the peak position of the high-excitation CH3OH thermal emission at the systemic velocity of the core (Sanna et al. 2014). This position represents the current best estimate of the YSO position. The χpol − χvel distribution has a weighted average of 58° and a weighted dispersion of ± 18° (gray area in Fig. 3a). In Figs. 3b and c, maser positions are projected along the two orthogonal axes defined by the direction of the molecular outflow (+58°) and that of the elongated HMC (−32°), with the origin at the HMC center.
Assuming a perfect symmetry of the gas dynamics with respect to these two axes, we produced a mirror image of the linear polarization vectors of each cloudlet on a single quadrant ( ). For the values, we also tried to solve the ambiguity of ± 180°, assuming that cloudlets that are close in space would show a smooth change in the polarization (and magnetic) field with position. A posteriori, this criterion was found to minimize the difference between the direction of the linear polarization vectors and that of the corresponding velocity vectors. In Figs. 3b and c, we identify two regions, labeled Regs. 1 and 2, where changes smoothly with the projected distance of the maser cloudlets. These regions are fit by a linear slope of about 0.2° AU-1, and they correspond to nearby cloudlets, which also show a smooth variation in the velocity field (Fig. 4). A third region, labeled Reg. 3, shows a variation in by more than 100° over a narrow range of projected distances. This region corresponds to cloudlets with the shortest projected distances, and is discussed further in Sect. 4.
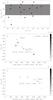 |
Fig. 3 Analysis of the polarization vectors’ orientation (χpol) as a function of the maser cloudlet position (see Sect. 3). a) Plot of the difference (and uncertainty) between the orientations of the velocity (χvel) and polarization (χpol) vectors as a function of the sky position angle (PA) of each cloudlet (defined in Sect. 3). Cloudlets with PA in the range 90°–270° have been folded in the range −90° < PA < 90°. The gray area indicates the boundary of the weighted standard deviation (± 1 σ) for the χpol–χvel values. b) Plot of |
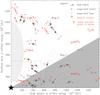 |
Fig. 4 Combined plot of the velocity and magnetic field measurements obtained from the 6.7 GHz CH3OH maser cloudlets (dots) in G023.01−00.41. The axes are aligned with the outflow and disk directions, as defined by the subarcsecond SMA observations in the 1 mm band from Sanna et al. (2014). The origin is set at the HMC center, as defined in Sect. 3 (star symbol in Fig. 2). The dark gray area indicates the region where emission from a flared disk with axes ratio of 1/2 is expected. The light gray area shows the region close to the outflow axis that is devoid of maser emission. For each maser cloudlet, the local directions of the velocity vector (red solid arrows) and/or that of the magnetic field vector (black solid lines) are reported where available. Empty dots are used for cloudlets that do not show polarized emission. The local average of both the magnitude and direction of the velocity field is indicated by red dotted arrows. These values were derived by grouping close-by features with similar velocity directions. The different regions identified through the polarization vectors analysis (Fig. 3) and labeled from 1 to 3 are indicated. For regions showing a smooth variation in the polarization (and magnetic) field vectors with the maser cloudlet position, we plot the families of curves (black dotted lines) that match the tangent to the local magnetic field measurements best (see Sect. 4). The pattern of these families of curves approximates the spatial morphology of the magnetic field lines locally. The direction of the velocity vectors is on average tilted by 30° with respect to the local magnetic field direction. |
4. Discussion
To infer the local magnetic field orientation, we ran the radiative transfer model by Vlemmings et al. (2010) for each cloudlet with detected linearly polarized emission (last columns of Table 1). According to the output parameters of this modeling (θ ≫ 55°), the magnetic field orientation is perpendicular to the polarization vectors for all maser components. This information is used in Fig. 4 to plot the local magnetic field orientation by rotating the values by 90°. More details about the radiative transfer modeling used can be found in Surcis et al. (2013).
In Fig. 4, we make use of the outflow/disk geometry described in Sanna et al. (2014) to give a complete picture of the velocity and magnetic fields within 1000 AU of the HMC center. In this plot, we produce a mirror image of all the measurements of the velocity and magnetic field vectors obtained from the 6.7 GHz CH3OH maser cloudlets, as if they were sampling a single quadrant defined by the outflow direction and the disk plane. This picture holds under the assumption that the gas dynamics shows a symmetric behavior with respect to the outflow axis and the disk plane. Given the uncertainty of 30° on the disk inclination (Sanna et al. 2014), one should keep in mind that the maser cloudlets might be closer to the disk plane than they appear. The high-density molecular tracers observed toward G023.01−00.41 show a fairly constant ratio of ~2 between the major and minor axes of the HMC. In Fig. 4, this ratio is interpreted as if it was due to a flared disk with a semi-opening angle of 30° (dark gray area). We also indicate a central region along the outflow axis that is devoid of CH3OH maser emission (light gray area).
In an attempt to derive a continuous magnetic field morphology, which reproduces the local maser measurements, we considered those regions (Regs. 1 and 2) that show a smooth change in the polarization vector (and magnetic field) orientation with the maser cloudlets’ positions. To first order, these slopes have been approximated by a linear fit as shown in Fig. 3 ( ). We can then integrate the tangent of [f(x) + 90°], in order to derive the families of curves that best fit the local magnetic field orientation at the maser cloudlet position. These curves give a first-order representation of the local morphology of the magnetic field lines (black dotted lines in Fig. 4).
The velocity field traced by maser cloudlets belonging to Regs. 1 and 2 provides a consistent picture of gas flowing out from the HMC center along the magnetic field lines. In Reg. 1, for small heights over the disk plane (<400 AU), the velocity field accommodates the magnetic field lines well, starting from projected distances of 600 AU up to about 1100 AU. Farther away, the velocity field mainly expands parallel to the disk plane and shows the highest maser velocities (~10 km s-1). On the other hand, maser cloudlets belonging to Reg. 2 and upward expand and get collimated in the direction of the outflow axis. In particular, as one proceeds upward along the magnetic field lines and closer to the outflow axis, both the velocity and magnetic field vectors independently undergo a turn of 90°. This feature may be interpreted as the result of the complex gas dynamics where a slow and a fast velocity component both exist (e.g., Seifried et al. 2012, their Fig. 12). Indeed, at about 2000 AU along the outflow axis (not shown in Fig. 4), a shock front of dense gas traced by H2O masers shows gas velocities of 20 km s-1 (Sanna et al. 2010b, their Fig. 5b), which is three times higher than those traced by the CH3OH gas in Reg. 2.
Methanol maser cloudlets belonging to Reg. 3 have projected distances of less than about 500 AU (dashed box in Fig. 4), along both the disk plane and the outflow axis. In this inner region, the velocity field is composed of (at least) two different motions: 1) an inflowing motion closer to the disk plane (y-offset <200 AU) and 2) an upward motion for higher offsets. The magnetic field pattern of this region is more complex, so we did not attempt to reproduce the magnetic field lines. Still, nearby cloudlets show a similar orientation of the magnetic field vectors and confirm the accuracy of our measurements.
Interestingly, Reg. 3 corresponds to a diffuse halo emission from strong CH3OH masers (Sanna et al. 2010b, see their Fig. 6b), which are probably saturated owing to the proximity of the central IR source. This ridge of extended emission is significantly elongated in the direction of the outflow axis, in agreement with the average orientation of the magnetic field vectors between y offsets of ~300 and 400 AU and the upward motions detected there. This evidence makes us speculate that Reg. 3 may trace the outer launching region of the primary outflow, in agreement with recent MHD simulations by Seifried et al. (2012, their Figs. 5 and 12). Furthermore, we make use of the inward stream of gas close to the disk plane, to obtain an estimate of the mass inflow rate,  . In this formula, R100, v10, and n8 are the mean radius of the inward stream in units of 100 AU, its velocity in units of 10 km s-1, and the volume density of molecular hydrogen in units of 108 cm-3, respectively. We take into account that the inward stream of gas is confined within an angle of 60° either side of the YSO and allow for gas densities as high as 108 cm-3, above which the Class ii CH3OH masers start to be quenched (Cragg et al. 2005). Noticeably, we find no maser detection at closer distances to the HMC center. At an average distance of 300 AU, the inward stream of gas, flowing at a velocity of 5 km s-1, brings a mass inflow rate of 2 × 10⁻⁴M⊙ yr-1.
We finally consider the average misalignment of 60° observed between the velocity and polarization vectors (Fig. 3a), which translates to 30° between the velocity and magnetic field vectors (Fig. 4). If gas and magnetic field were fully coupled, we would observe gas flowing along the magnetic field lines and expect an average misalignment close to zero. Given that the observed misalignment appears randomly distributed (1σ = ± 18°) around 30°, we model this effect as if it were due to a random (turbulent) velocity component, which adds to ordered velocity vectors aligned with the magnetic field lines. By considering a velocity vector of 7 km s-1, as averaged across the whole region, we estimate this turbulent contribution to be on the order
of 3.5 km s-1. This value is very similar to the velocity dispersion (4–5 km s-1) derived from the CH3CN linewidth in the inner 3000 AU from the HMC center (Sanna et al. 2014), which supports our estimate.
Online material
Parameters of 6.7 GHz methanol maser cloudlets with detected linear polarization.
The European VLBI Network is a joint facility of European, Chinese, South African, and other radio astronomy institutes funded by their national research councils.
Acknowledgments
Financial support by the Deutsche Forschungsgemeinschaft (DFG) Priority Program 1573 is gratefully acknowledged. W.V. acknowledges financial support from the European Research Council through ERC consolidator grant 614264. A.C.G. was supported by the Science Foundation of Ireland, grant 13/ERC/I2907. A.S. thanks S. Leurini for helpful discussions in preparation.
References
- Brunthaler, A., Reid, M. J., Menten, K. M., et al. 2009, ApJ, 693, 424 [NASA ADS] [CrossRef] [Google Scholar]
- Cragg, D. M., Sobolev, A. M., & Godfrey, P. D. 2005, MNRAS, 360, 533 [NASA ADS] [CrossRef] [Google Scholar]
- Crutcher, R. M., Wandelt, B., Heiles, C., Falgarone, E., & Troland, T. H. 2010, ApJ, 725, 466 [NASA ADS] [CrossRef] [Google Scholar]
- Goddi, C., Moscadelli, L., & Sanna, A. 2011, A&A, 535, L8 [NASA ADS] [CrossRef] [EDP Sciences] [Google Scholar]
- Keimpema, A., Kettenis, M. M., Pogrebenko, S. V., et al. 2015, Exper. Astron., 39, 259 [Google Scholar]
- Moscadelli, L., Sanna, A., & Goddi, C. 2011, A&A, 536, A38 [NASA ADS] [CrossRef] [EDP Sciences] [Google Scholar]
- Sanna, A., Moscadelli, L., Cesaroni, R., et al. 2010a, A&A, 517, A71 [NASA ADS] [CrossRef] [EDP Sciences] [Google Scholar]
- Sanna, A., Moscadelli, L., Cesaroni, R., et al. 2010b, A&A, 517, A78 [NASA ADS] [CrossRef] [EDP Sciences] [Google Scholar]
- Sanna, A., Cesaroni, R., Moscadelli, L., et al. 2014, A&A, 565, A34 [NASA ADS] [CrossRef] [EDP Sciences] [Google Scholar]
- Seifried, D., Banerjee, R., Klessen, R. S., Duffin, D., & Pudritz, R. E. 2011, MNRAS, 417, 1054 [NASA ADS] [CrossRef] [Google Scholar]
- Seifried, D., Pudritz, R. E., Banerjee, R., Duffin, D., & Klessen, R. S. 2012, MNRAS, 422, 347 [NASA ADS] [CrossRef] [Google Scholar]
- Surcis, G., Vlemmings, W. H. T., van Langevelde, H. J., HutawarakornKramer, B., & Quiroga-Nuñez, L. H. 2013, A&A, 556, A73 [NASA ADS] [CrossRef] [EDP Sciences] [Google Scholar]
- Surcis, G., Vlemmings, W. H. T., van Langevelde, H. J., et al. 2015, A&A, 578, A102 [NASA ADS] [CrossRef] [EDP Sciences] [Google Scholar]
- Vlemmings, W. H. T., Surcis, G., Torstensson, K. J. E., & van Langevelde, H. J. 2010, MNRAS, 404, 134 [NASA ADS] [Google Scholar]
- Wardle, J. F. C., & Kronberg, P. P. 1974, ApJ, 194, 249 [NASA ADS] [CrossRef] [Google Scholar]
- Zhang, Q., Qiu, K., Girart, J. M., et al. 2014, ApJ, 792, 116 [NASA ADS] [CrossRef] [Google Scholar]
All Tables
Parameters of 6.7 GHz methanol maser cloudlets with detected linear polarization.
All Figures
|
Fig. 1 Effelsberg total-power spectra toward G023.01−00.41, obtained from EVN observations at C-band, over 5 yr (from Sanna et al. 2010b, and current measurements). Observing dates are indicated in the top right of the plot. The dotted vertical line indicates the systemic velocity (Vsys) of the HMC, as inferred from CH3CN measurements. |
| In the text | |
|
Fig. 2 Comparison of the velocity and polarization vectors across the CH3OH maser distribution in G023.01−00.41. We show the distribution of the 6.7 GHz maser cloudlets (dots) within a field of view of about 2000 AU, following Sanna et al. (2010b, their Fig. 6). Maser velocities along the line of sight are color-coded according to the righthand VLSR scale. Lines drawn on individual maser cloudlets indicate the orientation of the velocity (red) and polarization (black) fields locally, as obtained from VLBI measurements. For clarity, velocity vectors are only shown for cloudlets with an associated polarization vector. For isolated maser cloudlets, numbers correspond to the maser labels given in Table 1. The star marks the peak position of the high-excitation CH3OH thermal line detected by Sanna et al. (2014), which is the origin of the reference system (e.g., upper right corner) used in Figs. 3 and 4. |
| In the text | |
|
Fig. 3 Analysis of the polarization vectors’ orientation (χpol) as a function of the maser cloudlet position (see Sect. 3). a) Plot of the difference (and uncertainty) between the orientations of the velocity (χvel) and polarization (χpol) vectors as a function of the sky position angle (PA) of each cloudlet (defined in Sect. 3). Cloudlets with PA in the range 90°–270° have been folded in the range −90° < PA < 90°. The gray area indicates the boundary of the weighted standard deviation (± 1 σ) for the χpol–χvel values. b) Plot of |
| In the text | |
|
Fig. 4 Combined plot of the velocity and magnetic field measurements obtained from the 6.7 GHz CH3OH maser cloudlets (dots) in G023.01−00.41. The axes are aligned with the outflow and disk directions, as defined by the subarcsecond SMA observations in the 1 mm band from Sanna et al. (2014). The origin is set at the HMC center, as defined in Sect. 3 (star symbol in Fig. 2). The dark gray area indicates the region where emission from a flared disk with axes ratio of 1/2 is expected. The light gray area shows the region close to the outflow axis that is devoid of maser emission. For each maser cloudlet, the local directions of the velocity vector (red solid arrows) and/or that of the magnetic field vector (black solid lines) are reported where available. Empty dots are used for cloudlets that do not show polarized emission. The local average of both the magnitude and direction of the velocity field is indicated by red dotted arrows. These values were derived by grouping close-by features with similar velocity directions. The different regions identified through the polarization vectors analysis (Fig. 3) and labeled from 1 to 3 are indicated. For regions showing a smooth variation in the polarization (and magnetic) field vectors with the maser cloudlet position, we plot the families of curves (black dotted lines) that match the tangent to the local magnetic field measurements best (see Sect. 4). The pattern of these families of curves approximates the spatial morphology of the magnetic field lines locally. The direction of the velocity vectors is on average tilted by 30° with respect to the local magnetic field direction. |
| In the text | |
Current usage metrics show cumulative count of Article Views (full-text article views including HTML views, PDF and ePub downloads, according to the available data) and Abstracts Views on Vision4Press platform.
Data correspond to usage on the plateform after 2015. The current usage metrics is available 48-96 hours after online publication and is updated daily on week days.
Initial download of the metrics may take a while.