Fig. 3
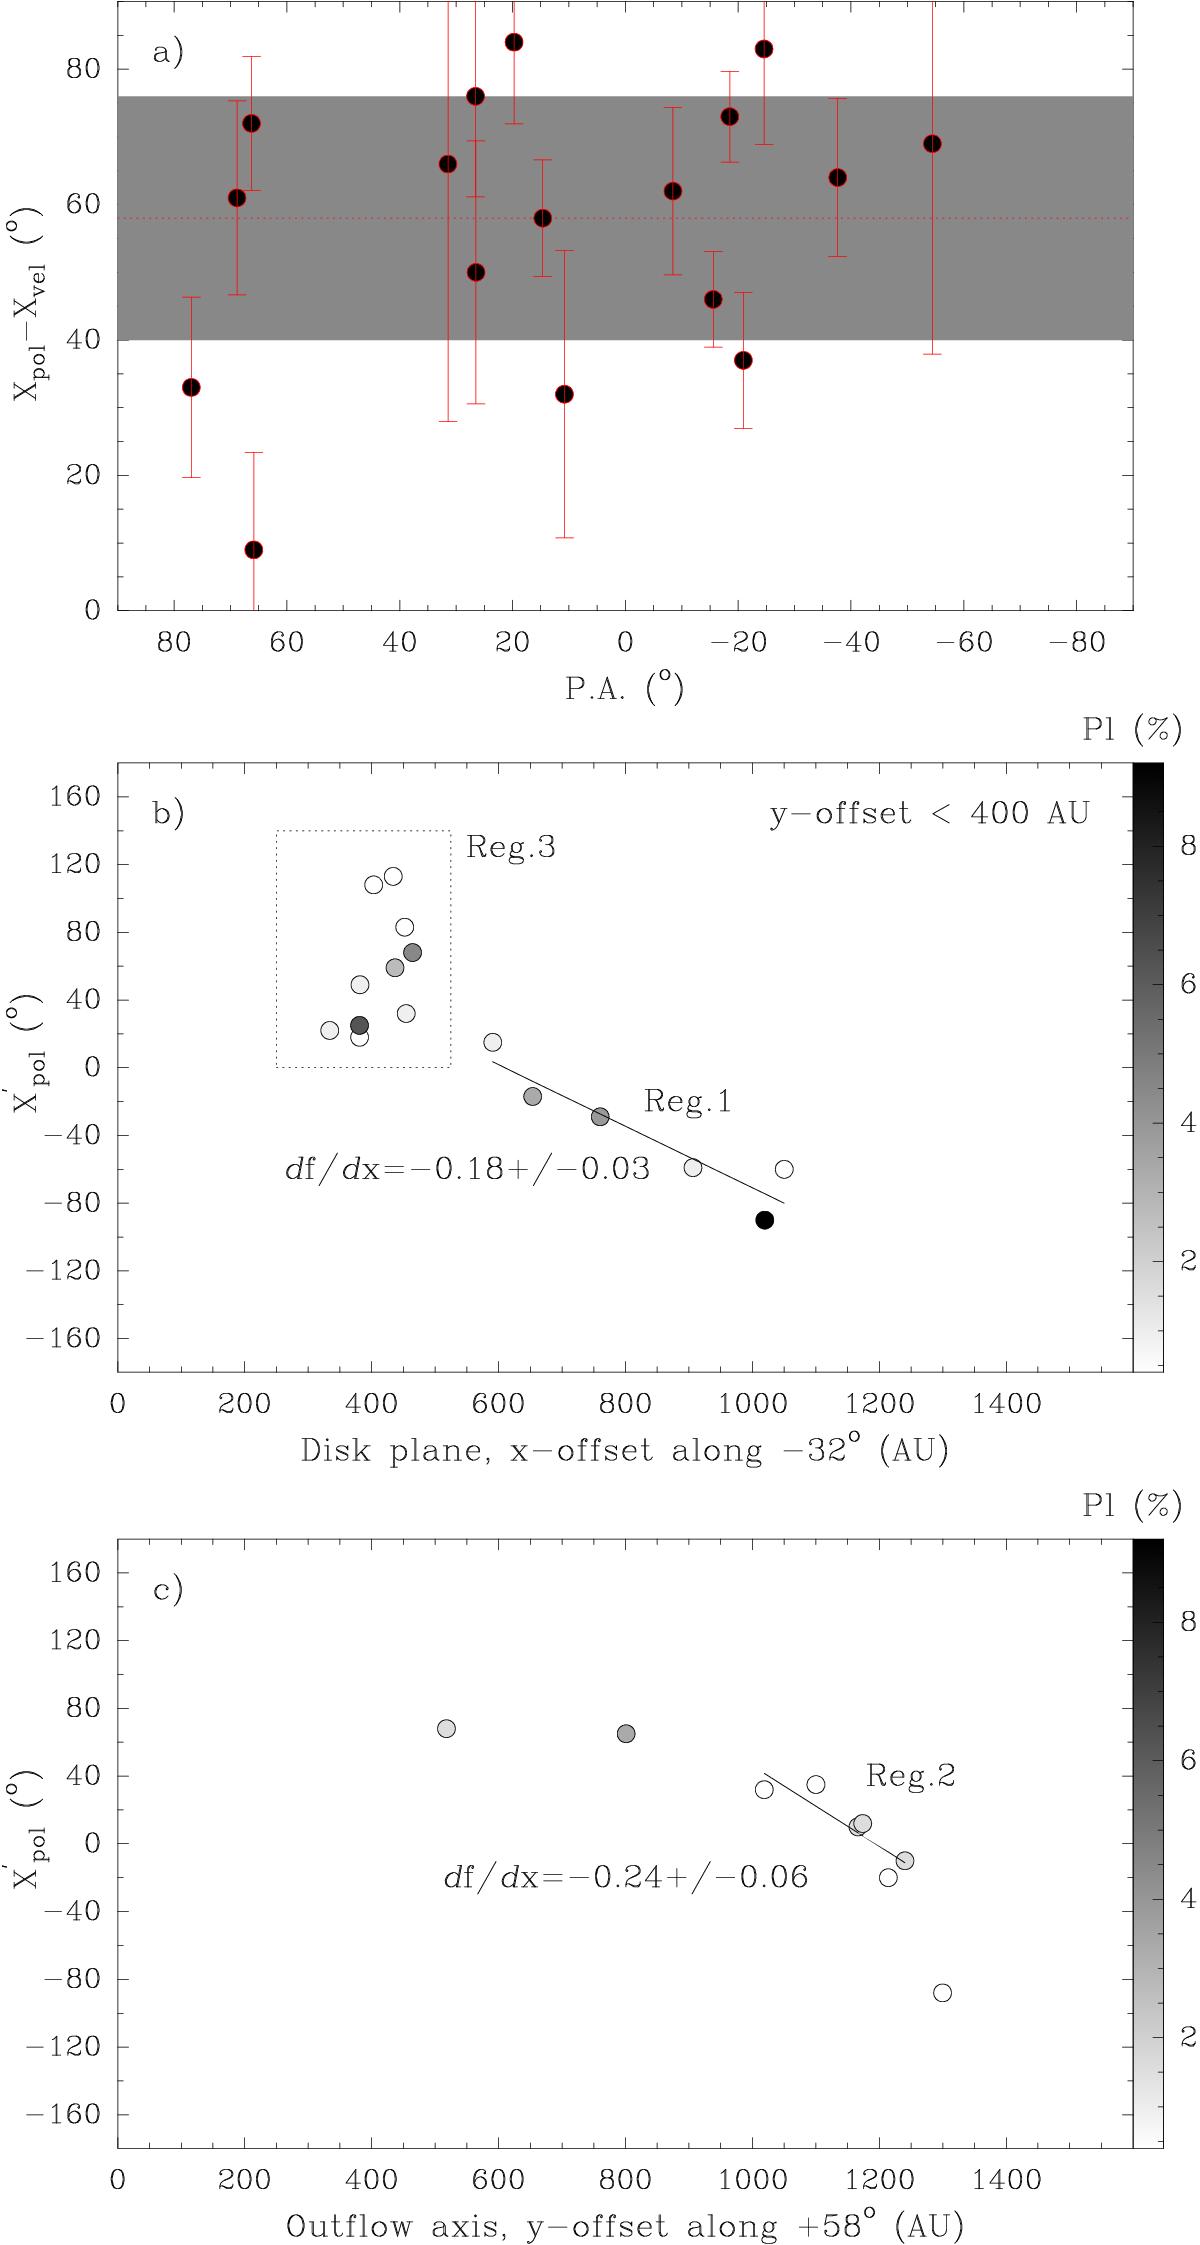
Analysis of the polarization vectors’ orientation (χpol) as a function of the maser cloudlet position (see Sect. 3). a) Plot of the difference (and uncertainty) between the orientations of the velocity (χvel) and polarization (χpol) vectors as a function of the sky position angle (PA) of each cloudlet (defined in Sect. 3). Cloudlets with PA in the range 90°–270° have been folded in the range −90° < PA < 90°. The gray area indicates the boundary of the weighted standard deviation (± 1 σ) for the χpol–χvel values. b) Plot of ![]() as a function of the projected distance along the equatorial plane of the HMC (−32°).
as a function of the projected distance along the equatorial plane of the HMC (−32°). ![]() gives the values of χpol as measured counterclockwise starting from a sky position angle of −32°. In this panel, only points with offsets less than 400 AU from the equatorial plane have been plotted. For each
gives the values of χpol as measured counterclockwise starting from a sky position angle of −32°. In this panel, only points with offsets less than 400 AU from the equatorial plane have been plotted. For each ![]() value, the polarization fraction is quantified according to the wedge on the righthand side. The uncertainty of the
value, the polarization fraction is quantified according to the wedge on the righthand side. The uncertainty of the ![]() measurements is of the same order as the marker size. The different regions identified in Sect. 3 are also indicated. c) Similar to panel b) with projected distances along the outflow axis (58°). Data points plotted in panel b) are not drawn.
measurements is of the same order as the marker size. The different regions identified in Sect. 3 are also indicated. c) Similar to panel b) with projected distances along the outflow axis (58°). Data points plotted in panel b) are not drawn.
Current usage metrics show cumulative count of Article Views (full-text article views including HTML views, PDF and ePub downloads, according to the available data) and Abstracts Views on Vision4Press platform.
Data correspond to usage on the plateform after 2015. The current usage metrics is available 48-96 hours after online publication and is updated daily on week days.
Initial download of the metrics may take a while.