Fig. 2
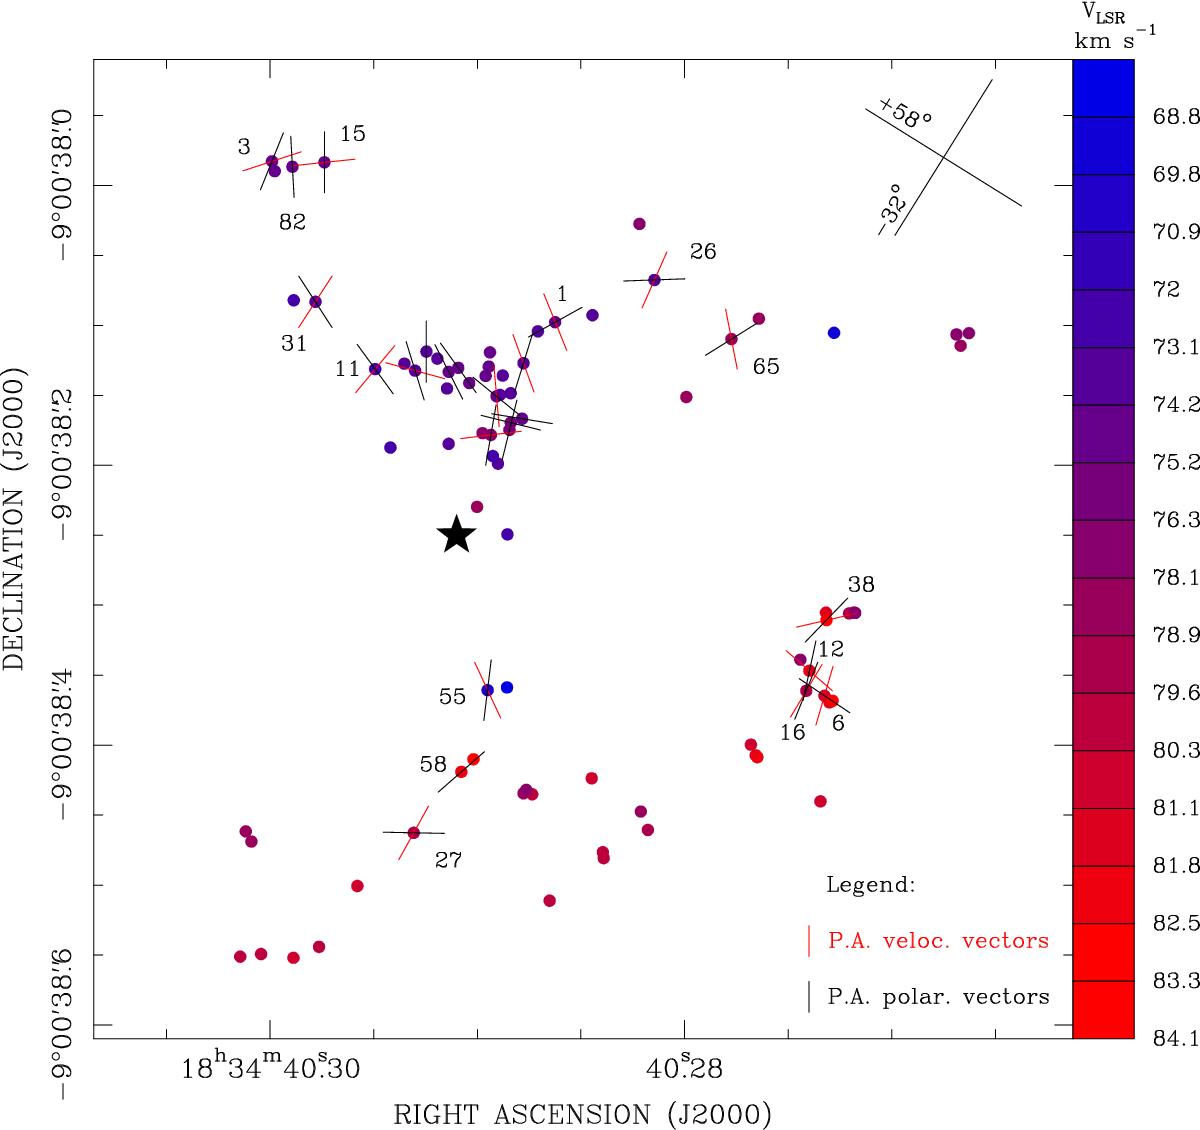
Comparison of the velocity and polarization vectors across the CH3OH maser distribution in G023.01−00.41. We show the distribution of the 6.7 GHz maser cloudlets (dots) within a field of view of about 2000 AU, following Sanna et al. (2010b, their Fig. 6). Maser velocities along the line of sight are color-coded according to the righthand VLSR scale. Lines drawn on individual maser cloudlets indicate the orientation of the velocity (red) and polarization (black) fields locally, as obtained from VLBI measurements. For clarity, velocity vectors are only shown for cloudlets with an associated polarization vector. For isolated maser cloudlets, numbers correspond to the maser labels given in Table 1. The star marks the peak position of the high-excitation CH3OH thermal line detected by Sanna et al. (2014), which is the origin of the reference system (e.g., upper right corner) used in Figs. 3 and 4.
Current usage metrics show cumulative count of Article Views (full-text article views including HTML views, PDF and ePub downloads, according to the available data) and Abstracts Views on Vision4Press platform.
Data correspond to usage on the plateform after 2015. The current usage metrics is available 48-96 hours after online publication and is updated daily on week days.
Initial download of the metrics may take a while.