Fig. 2
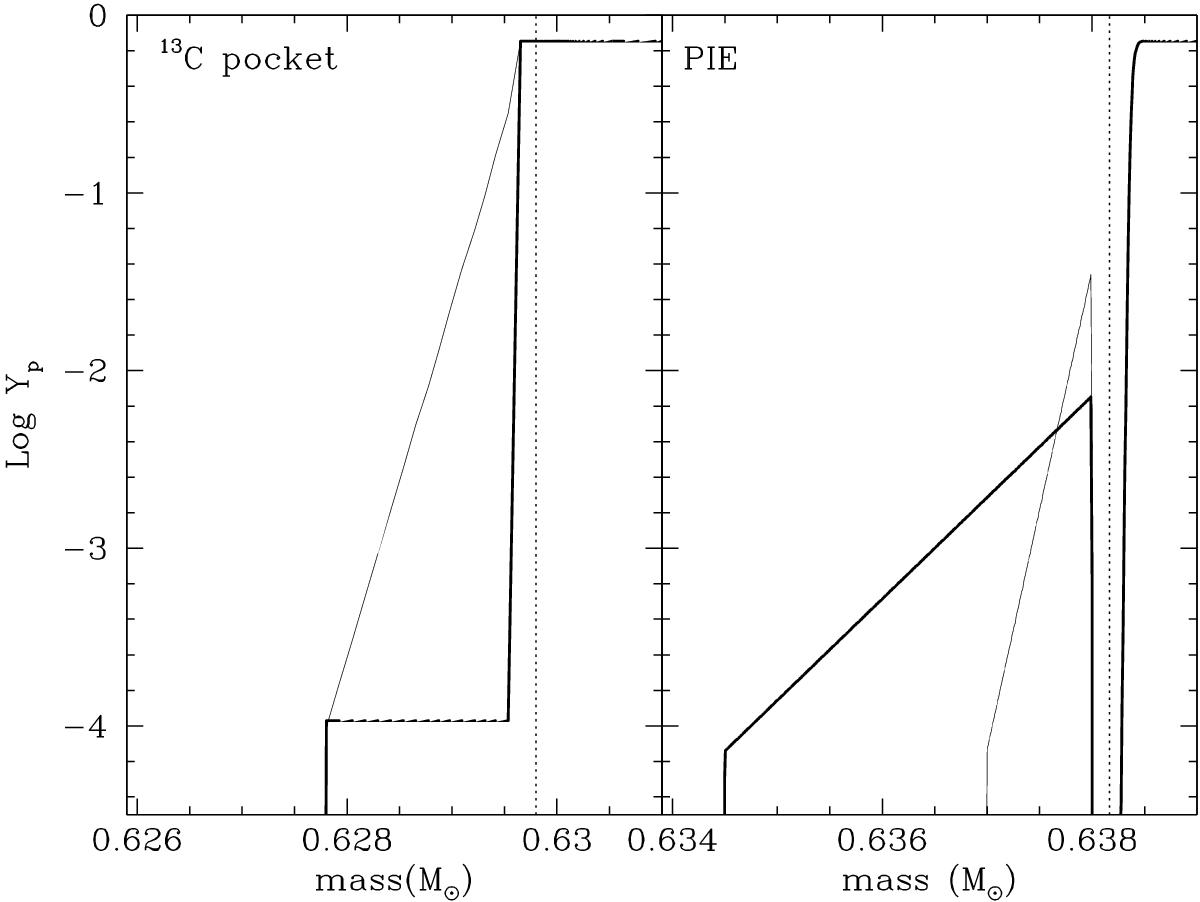
Proton abundance distribution artificially inserted during the post-processing in our models to simulate the formation of a 13C pocket after the 12th TP (left panel) and a PIE event during TP13 (right panel). Left panel: the thin line represents the standard exponentially decreasing proton distribution (pocket_case1) and the thick line the case where the proton abundance Yp is set to constantly equal 1.05 × 10⁻⁴ (pocket_case4). The dotted line represents the depth reached by the TDU. Right panel: the thin and thick lines represent two different proton distributions with a similar total amount of protons ingested: PIE_case1 (thin line) and PIE_case2 (thick line). The dotted line represents the maximum extension of the intershell convective region associated with TP13. The steep proton profile left over by the H-burning shell is also shown in the plot just above 0.638 M⊙.
Current usage metrics show cumulative count of Article Views (full-text article views including HTML views, PDF and ePub downloads, according to the available data) and Abstracts Views on Vision4Press platform.
Data correspond to usage on the plateform after 2015. The current usage metrics is available 48-96 hours after online publication and is updated daily on week days.
Initial download of the metrics may take a while.