| Issue |
A&A
Volume 583, November 2015
|
|
|---|---|---|
| Article Number | A76 | |
| Number of page(s) | 10 | |
| Section | Galactic structure, stellar clusters and populations | |
| DOI | https://doi.org/10.1051/0004-6361/201526575 | |
| Published online | 30 October 2015 | |
RAVE stars tidally stripped or ejected from the ω Centauri globular cluster⋆,⋆⋆
1
Institut Utinam, CNRS UMR 6213, Université de Franche-Comté, OSU THETA
Franche-Comté-Bourgogne, Observatoire de Besançon,
BP 1615,
25010
Besançon Cedex,
France
e-mail: This email address is being protected from spambots. You need JavaScript enabled to view it.
2
Centro de Investigaciones de Astronomía,
AP 264, 5101-A Mérida,
Venezuela
3
Instituto de Astronomía, Universidad Nacional Autónoma de
México, Apdo. Postal
70264, 04510
México D.F.,
Mexico
4
Observatoire astronomique de Strasbourg, Université de Strasbourg,
CNRS, UMR 7550, 11 rue de l’Université, 67000
Strasbourg,
France
5
Instituto de Ciencias Nucleares, Universidad Nacional Autónoma de
México, Ap. 70-543,
04510
D.F., México, Mexico
Received: 20 May 2015
Accepted: 10 August 2015
Abstract
Using six-dimensional phase-space information from the Fourth Data release of the RAdial Velocity Experiment (RAVE) over the range of Galactic longitude 240°<l< 360° and VLSR< −239 km s-1, we computed orbits for 329 RAVE stars that were originally selected as chemically and kinematically related to ω Centauri. The orbits were integrated in a Milky-Way-like axisymmetric Galactic potential, ignoring the effects of the dynamical evolution of ω Centauri due to the tidal effects of the Galaxy disk on the cluster along time. We also ignored secular changes in the Milky Way potential over time. In a Monte Carlo scheme, and under the assumption that the stars may have been ejected with velocities greater than the escape velocity (Vrel>Vesc,0) from the cluster, we identified 15 stars as having close encounters with ω Centauri: (i) 8 stars with relative velocities Vrel< 200 km s-1 may have been ejected ~200 Myr ago from ω Centauri; (ii) another group of 7 stars were identified with high relative velocity Vrel> 200 km s-1 during close encounters, and it seems unlikely that they were ejected from ω Centauri. We also confirm the link between J131340.4-484714 as a potential member of ω Centauri, and probably ejected ~2.0 Myr ago, with a relative velocity Vrel ~ 80 km s-1.
Key words: stars: abundances / stars: kinematics and dynamics / Galaxy: structure / globular clusters: individual: ωCentauri
Appendix A is available in electronic form at http://www.aanda.org
Full Table A.1 is only available at the CDS via anonymous ftp to cdsarc.u-strasbg.fr (130.79.128.5) or via http://cdsarc.u-strasbg.fr/viz-bin/qcat?J/A+A/583/A76
© ESO, 2015
1. Introduction
Known as the most massive and luminous globular cluster of the Milky Way halo, ω Centauri also shows unique physical properties in its structure, chemical enrichment, and internal kinematics (Freeman & Rodgers 1975; Norris et al. 1997; Lee et al. 1999; Hughes & Wallerstein 2000; Gnedin et al. 2002; Mizutani et al. 2003; Pancino et al. 2003; Hilker et al. 2004; Bedin et al. 2004; Sollima et al. 2007, 2009; Bellini et al. 2009, 2010; Johnson & Pilachowski 2010; Moriya & Shigeyama 2010; Da Costa 2012). The nature and origin of ω Centauri is still controversial. It has been proposed that ω Centauri is the remnant core of a tidally disrupted satellite galaxy, which was possibly destroyed long ago by the Milky Way (Lee et al. 1999; Majewski et al. 2000; Bekki & Freeman 2003; Mizutani et al. 2003; Ideta & Makino 2004; Tsuchiya et al. 2004; Romano et al. 2007; Sollima et al. 2009), and some recent works suggest that it could have originated from an even more massive system of about 109M⊙ (Valcarce & Catelan 2011).
In this scenario it is expected that the orbit of such progenitor would have evolved over time because of the interaction with the Milky Way (Tsuchiya et al. 2003; Bekki & Freeman 2003; Zhao 2004; Ideta & Makino 2004) and part of its residual material would be distributed in the Galactic halo. Several efforts have been made, with various degrees of success, to detect the relics of ω Centauri’s progenitor. Among those studies that have explored the surroundings of the cluster, looking for the controversial pair of tidal tails extending from it and reported by Leon et al. (2000), are one showing that the effects of differential reddening as spurious effects on the detection of tidal tails (Law et al. 2003), the spectroscopy survey of 4000 stars selected from the cluster red giant branch done by Da Costa & Coleman (2008), and the more recent photometric survey of RR Lyrae stars over ~50 square degrees around the cluster by Fernández-Trincado et al. (2013, 2015). None of these works found evidence of stellar overdensities beyond the tidal radius of ω Centauri. However, different results are inferred from the photometric analysis of the STREGA survey (Marconi et al. 2014, STRructure and Evolution of the GAlaxy), whose tracers are mainly variable stars (RR Lyraes and long-period variables) and main-sequence turn-off stars. These authors found evidence of stellar overdensities at ~1° from the cluster in the direction perpendicular to what was explored in the STREGA survey; nonetheless, nonetheless a more detailed chemical abundance and kinematics analysis would help to verify this result.
Stellar debris features associated with ω Centauri have also been identified recently in a wide range of Galactic latitude and, more particularly, in the solar neighborhood, with chemical patterns and kinematics properties similar to inner populations of the cluster (Nissen & Schuster 2010; Wylie-de Boer et al. 2010; Majewski et al. 2012). More recently a group of RAVE stars with radial velocities and chemical abundances consistent with stars observed from ω Centauri cluster has been detected by (Kunder et al. 2014). As mentioned by Meza et al. (2005), the presence of nearby stars with odd kinematics and chemistry, suggests an extra-Galactic origin for them, possibly what they call “tidal relics”.
From that starting point, we decided to investigate the kinematical properties of those stars that tend to have retrograde motion (VLSR< −239 km s-1), looking for the presence of ω Centauri debris. We adopted an idea similar to that of Pichardo et al. (2012) and combined the accurate radial velocities, distances, and [Fe/H] abundances from the Fourth Data Release of the Radial Velocity Experiment survey (RAVE DR4) by Kordopatis et al. (2013), with proper motions from the US Naval Observatory CCD Astrograph Catalog (UCAC4) by Zacharias et al. (2013), to select a sample of giant stars that are chemically and kinematically similar to ω Centauri. For each of star in the sample, we integrated 105 orbits in a Milky-Way-like axisymmetric potential to evaluate the probability that close previous encounters have occurred between the star and ω Centauri, within the cluster’s tidal radius.
This paper is organized as follows. In Sect. 2 we describe the data and methods for selecting star candidates. In Sect. 3 we briefly explore the effects of contamination in our sample by different Galactic components. In Sect. 4 we describe the orbital model. Results and discussion are presented in Sect. 5. Finally, conclusions are presented in Sect. 6.
2. Sample selection from RAVE
The sample was selected from the RAVE DR4 catalog (Kordopatis et al. 2013), which provides accurate radial velocities with typical errors of σRV ~ 2 km s-1, and distances and individual abundances with errors of about 10–20%, determined for approximately 390 000 relatively bright stars (9 mag <IDENIS< 13 mag). The proper motions on RAVE DR4 were compiled from several catalogs, however, in this work we use UCAC4 (Zacharias et al. 2013). We used these data to make a kinematical selection of RAVE stars possibly related to ω Centauri, also taking spatial distribution and metallicity into account, as well as some additional quality control cuts to select robust data.
In this work we restricted our study to RAVE stars with Galactic longitudes 240°<l< 360°, where ω Centauri’s remnant candidates have been found (e.g., Majewski et al. 2012). We restricted our sample to giant stars, with effective temperature between 4000–5500 K, and surface gravity 0.5 dex < log (g) < 3.5 dex, following Boeche et al. (2011). Additionally, we required the stars to have high quality spectra (χ2< 2000) with a signal-to-noise ratio S/N> 20 (algo_conv = 0 was required, indicating that the pipeline converges, see Kordopatis et al. 2013). This cut allowed us to obtain precise radial velocity measurements, typically σRV< 2 km s-1, in order to constraint the full space motion. The metallicity [Fe/H] distribution for giant stars within ω Centauri spans more than a magnitude order, from –2.2 dex < [Fe/H] < −0.7 dex (Johnson & Pilachowski 2010), therefore we allowed stars in our sample to be in this range of metallicity.
A total of 9024 RAVE stars in our final sample passed the selection and quality controls described above. Distances, radial velocity and proper motions are all available for this sample.
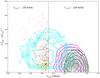 |
Fig. 1 Toomre diagram for RAVE stars and their simulation with the Besançon Galaxy model. RAVE stars with quality control cuts (see Sect. 2) are shown in gray dots. ω Centauri is shown with the green symbol. Isocontours refers to thin-disk (green), young thick-disk (black dashed), old thick-disk (magenta) and halo (cyan) simulated RAVE stars. Orange symbols (8 stars) with error bars correspond to RAVE stars that have a high probability of encountering ω Centauri and relative velocity Vrel< 200 km s-1 (see Sect. 5), and red dots (314 stars) correspond to halo stars having a negligible probability (<0.01%) of encountering ω Centauri (see Sect. 4). The vertical dashed line indicates zero Galactic rotation. (A color version of this figure is available in the online journal.) |
2.1. Kinematic selection
With the RAVE kinematics and distances as input from the selected sample, galactic space velocities (U,V,W) were computed according to the matrix equations of Johnson & Soderblom (1987). For reference, we have adopted a righthanded coordinate system for (U,V,W), so that they are positive in the directions of the galactic center, galactic rotation, and north galactic pole, respectively. In this convention, we have adopted the solar motion with respect to the Local Standard of Rest (U⊙,V⊙,W⊙) = (11.10,12.24,7.24) km s-1 assumed that the Local Standard of Rest is on a circular orbit with a circular speed of 239 km s-1 and the Sun is located at R⊙ = 8.3 kpc (e.g., Brunthaler et al. 2011).
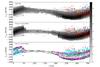 |
Fig. 2 RAVE stars in the Galactocentric radial velocity (VGRV) vs. Galactic longitude space. The top panel refers to RAVE data, the middle and bottom panels refer to Besançon-galaxy model-simulated RAVE data. ω Centauri is shown with the green cross. Majewski et al. (2012) stellar “streams” are plotted with blue symbols. Probable members found in this work are represented by orange symbols and are the same as in Fig. 1 with their size proportional to the probability of close encounter with the cluster (see Sect. 4), and RAVE halo stars having a negligible probability of encountering with ω Centauri are shown with red dots. The black contours show the full RAVE sample and simulations, respectively. The colored contours refers to the Galactic components from the simulation as in Fig. 1. The gray scale refers to the logarithm of the number of stars in it, as indicated by the color bar. (A color version of this figure is available in the online journal.) |
Figure 1 shows the Toomre diagram for the thin disk, young/old thick-disk and halo stars from the revised version of the Besançon Galaxy model (Robin et al. 2014). The gray dots represent the 9024 RAVE stars previously selected. As seen in the Toomre diagram, most RAVE stars are kinematically consistent with the different Galactic components. Then, stars with VLSR< −239 km s-1 are more probably Galactic halo stars, and this work is focused on studying the orbits of these stars and their possible connection with ω Centauri.
Majewski et al. (2012) suggest that ω Centauri tidal debris is a primary contributor to retrograde-velocity stars near the Sun. In fact, evidence has been found of field stars associated with ω Centauri in the Galactic disk by Wylie-de Boer et al. (2010). The cut VLSR< −239 km s-1 acts as kinematical membership selection and helps us to obtain a sample of 329 stars that is mostly free of contamination by the Galaxy’s thin and thick disks. Given the magnitudes of these stars, we have been able to explore past dynamic links between these RAVE stars and ω Centauri. For these stars we computed orbits using an axisymmetric model of the Galaxy scaling the model of Allen & Santillan (1991). (Gravitational potential details can be seen in Sect. 4.)
3. Kinematic contaminants from the Milky Way
To estimate the kinematical contamination in our sample by stars from the Galaxy, we simulated the RAVE data with the Besançon Galaxy model. We used the new version described in Robin et al. (2014) where the thick-disk and halo characterizations have been revised according to SDSS and 2MASS data. Moreover, the kinematics of the different populations is computed using a corrected asymmetric drift formula (Robin et al., in prep.) reliable outside the Galactic plane. The velocity ellipsoid of the halo is assumed to be (131, 106, 85) km s-1 with the major axis pointing toward the Galactic center. To simulate the RAVE data, we ran a simulation for all the directions, and then a subsample of stars was randomly chosen in each magnitude bin in the I filter, containing exactly the same number of stars observed by RAVE. A full comparison of this new Besançon Galaxy model with RAVE will be presented in a future paper (Robin et al., in prep.).
In Fig. 2, we present a comparison of the radial velocity relative to the Galactic rest-frame (VGRV) distribution for the simulated sample and the RAVE data. To obtain VGRV, which is simply the star’s radial velocity as seen from the Sun’s location but in a reference frame at rest with the Galaxy, we use the formulation given by Hawkins et al. (2015) and the following equation: ![Mathematical equation: \begin{eqnarray} \label{GRV} V_{\rm GRV}\!\equiv\! {\rm RV} \!+\! [U_{\odot}\cos(l) \!+\! (V_{\odot} \!+\! V_{\rm LSR})\sin(l)]\cos(b)\! +\! W_{\odot}\sin(b). \end{eqnarray}](/articles/aa/full_html/2015/11/aa26575-15/aa26575-15-eq33.png) (1)The Besançon Galaxy model reproduces the general kinematics observed in the RAVE data very well, as evidenced by the signal of the disk observed in the sinusoidal-like density path seen in Fig. 2, with a higher density around l = 270° and VGRV ~ −220 km s-1 (e.g., Hawkins et al. 2015).
(1)The Besançon Galaxy model reproduces the general kinematics observed in the RAVE data very well, as evidenced by the signal of the disk observed in the sinusoidal-like density path seen in Fig. 2, with a higher density around l = 270° and VGRV ~ −220 km s-1 (e.g., Hawkins et al. 2015).
Derived ejection parameters for the 15 RAVE stars more likely to have close encounters with ω Centauri.
Assuming Gaussian velocity distributions and asymmetric drifts for the thin-disk, young/old thick-disk and halo components, stars with Vtotal> 180 km s-1 have a high probability of belonging to the halo (see Nissen & Schuster 2010, and references therein). However, in the case of the Besançon Galaxy model (Robin et al. 2014), the velocity distribution of the thick-disk is non-Gaussian with an extended tail toward Vtotal< 239 km s-1. Then in our simulated RAVE stars, those with 180 kms-1<Vtotal< 239 km s-1 might belong to the thick-disk population. In this sense, since our selected stars have VLSR< −239 km s-1, they are most probably free of thick-disk contamination (and certainly free of the thin-disk one); nonetheless, we could expect halo stars with a preferential retrograde motion in the Galactic longitude 240°<l< 360° explored in this work.
4. Orbits in an axisymmetric Galactic model
In this work, we ran 105 pairs of orbits for each RAVE star and ω Centauri cluster pair, using the Monte Carlo scheme1 describe in Pichardo et al. (2012). For each Monte Carlo set of orbits pairs, the proper motions, radial velocities, and distances, with their respective error bars are used for both the star and the cluster. As initial test, we calculated orbits backward in time over 1 Gyr from the current position and velocity of ω Centauri in a Milky-Way-like axisymmetric Galactic potential (dynamical friction, spiral arms and bar effects are ignored), which is the Allen & Santillan (1991) model (see details in Pichardo et al. 2012), but scaled with the new values R0 = 8.3 kpc, Θ0 = 239 km s-1 given by Brunthaler et al. (2011). Each Monte Carlo run employs a different scaled Galactic potential, using the uncertainties in R0 and Θ0.
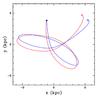 |
Fig. 3 Orbit projection in the potential axisymmetric for “J131340.4−484714” (blue line) and ω Centauri (red line) in X,Y Galactic coordinates on the Galactic plane. The solar position is (X⊙, Y⊙, Z⊙) = (8.3, 0, 0) kpc in t = 0 Gyr. The solid curves show the orbits integrated backwards from initial position in t = 0 Gyr (open symbols) to τenc = 0.2 Gyr (filled symbols) that have a close encounter with dmin< 100 pc. (A color version of this figure is available in the online journal.) |
Then, we calculated the probability2 of close encounters in the past, which was defined as: (i) having a minimum approach distance, dmin< 100 pc (e.g., Fernández-Trincado et al. 2015), such that during the encounter the RAVE star is within the region of bounded stellar motions of ω Centauri; (ii) having an encounter time, τenc< 0.2 Gyr, in which the bar shape of the Galactic bulge and its effect on the Galactic orbits may be approximately ignored. The latter assumption is supported by the results in Appendix A. (We verify that the introduction of a bar in our potential, using the prolate bar model of Pichardo et al. 2004, does not change our clonclusions significantly for eight of our candidates with relative velocities Vrel< 200 km s-1 listed in Table 1.) ω Centauri has an orbital period τorb ~ 0.08−0.12 Gyr (e.g., Dinescu et al. 1999; Mizutani et al. 2003), thus in 0.2 Gyr the cluster will have approximately two perigalactic points.
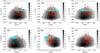 |
Fig. 4 2D density plot for [X/H] and VGRV in the Galactic longitude range 240°<l< 360°. The orange and red symbols are the same as in Fig. 1. The cyan dots refer to ω Centauri members from Johnson & Pilachowski (2010). (A color version of this figure is available in the online journal.) |
To illustrate the orbital behavior in about 0.2 Gyr, Fig. 3 shows an example of a pair of orbital star clusters for a RAVE star that will have a close encounter (dmin< 100 pc) with ω Centauri in τenc ~ 0.2 Gyr and a relative velocity of Vrel = 53.6 km s-1. The average-distance star cluster is davg = 0.9 kpc, from t = 0 Gyr until the close encounter time (t = τenc).
For ω Centauri itself, we calculate the orbit, based on the current distance of 5.57 ± 0.08 kpc (Navarrete et al. 2015), proper motion μαcos(δ) = −5.08 ± 0.35 mas yr-1 and μδ = −3.57 ± 0.34 mas yr-1, radial velocity 232.2 ± 0.7 km s-1 (Dinescu et al. 1999), and position α =13h26m47.24s and δ = −47°28′46.5′′ (Harris 1996).
We briefly highlight some limitations of our calculation, since we ignore the effects of (i) dynamical evolution of the cluster and tidal effects on the cluster exerted by the Galactic disk in each orbit; (ii) mass loss. Because ω Centauri was probably more massive in the past (see Bekki & Freeman 2003; Ideta & Makino 2004), this reduces the probabilities we find. We have also ignored secular changes in the Milky Way potential over time (Lind et al. 2015).
5. Results and discussion
Within the sample of 329 stars with VLSR< −239 km s-1, a group of 15 RAVE stars were identified as having a probable encounter with ω Centauri within 0.2 Gyr at 100 pc distance, and another group of 314 stars as having unprobable (<0.01%) close encounter with ω Centauri with the same distance and time limit.
For those 15 stars with probable encounters, we identified seven with high relative velocities Vrel> 200 km s-1, for which it is unlikely that they have been ejected from ω Centauri; and eight stars were identified with relative velocities Vrel< 200 km s-1, which are more likely associated with ω Centauri (both groups of stars are listed Table 1). These stars (8 more likely) have an average Galactic rotation velocity of VLSR ~ −280.9 ± 37.5 km s-1, which is close to that of the ω Centauri, VLSR = −265.3 ± 55.0 km s-1, as computed by us from the cluster’s data. The resulting values ULSR,VLSR, and WLSR for these stars are given in Table A.1, which gives the same parameters for the 314 stars classified as unlikely to have been ejected from ω Centauri.
We identified 314 RAVE stars with unlikely (or null) encounters with ω Centauri occurred within 100 pc. Figure 2 shows that their Galactocentric radial velocity (red symbols) agrees with the kinematics predicted by the Besançon Galaxy model for the halo. Their [Fe/H] and VLSR agrees with characteristics of the inner Galactic halo (e.g., Dinescu et al. 1999).
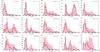 |
Fig. 5 Distribution of relative velocities (Vrel) during close encounters for the whole integration time, t = 1 Gyr (pink histograms), and t< 0.2 Gyr (black histograms). (A color version of this figure is available in the online journal.) |
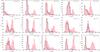 |
Fig. 6 davg distributions, defined as the average distance between pairs of orbits through the Galaxy from the present time (or t = 0 Gyr) until the close encounter time (τenc). The pink distribution refers to the whole integration time (1 Gyr), and the black distribution refers to close encounters with relative velocities within 0.2 Gyr and 100 pc distance. (A color version of this figure is available in the online journal.) |
Figure 2 shows stellar debris candidates (blue symbols) from Majewski et al. (2012), with a kinematical and chemical pattern linked to ω Centauri. In the same figure, stars in our kinematical and chemical RAVE selection (orange symbols) have retrograde orbits similar to that of ω Centauri, and are kinematically coherent with the Majewski et al. (2012) sample. It is also evident that our 15 RAVE stars candidates with retrograde velocities do not follow the disk kinematics in both Figs. 1 and 2.
We also identified on star in our sample with RAVEID = J131340.4−484714, previously identified beyond the cluster tidal radius by Anguiano et al. (2015) and listed as a potential member of the ω Centauri globular cluster. Under our numerical simulation scheme, we found 3582 orbits for J131340.4−484714 having close encounters with ω Centauri; i.e., our results suggest that the star has been ejected from ω Centauri with an ejection velocity (Vejection ~ 80 km s-1). Figure 5 shows that this star could have been ejected approximately ~2.0 Myr ago, following an orbit very close to ω Centauri as is evident in the Fig. 6 . This peculiar star could also be a rare “no-escaper”; that is, a star on a stable orbit outside the cluster tidal radius (Ross et al. 1997).
5.1. Close encounters: star-Cluster
Figures 5 and 6 show the relative velocity (Vrel) distribution for 15 RAVE stars having close encounters in the past, and the average distance (davg) distribution for the pairs of orbits from t = 0 Gyr to t = τenc, respectively. As is evident in Fig. 5, the vast majority of the close encounters are produced during time intervals less than approximately two times the orbital period of ω Centauri with relative velocities Vrel< 200 km s-1 (e.g., Lind et al. 2015) in most cases, and closed orbits with low values of davg, such that the pairs of orbits (star – cluster) travel with close distances between them (see illustrated example in Fig. 3), i.e., this approach clearly suggests that their orbits are confined to the ω Centauri orbit. Table 1 lists 15 RAVE stars with the more frequent relative velocity (Vrel), average distance (davg), and enconter time (τenc) for each Monte Carlo simulation.
The escape velocity of the ω Centauri cluster at the center is about Vesc,0 = 60.4 km s-1, and at the cluster half-mass radius Vesc,h = 44 km s-1 (e.g., Gnedin et al. 2002). Given the observational errors and relative velocity Vrel>Vesc,0 star-cluster encounters, it seems unlikely that the star has been tidally stripped from the cluster, since this mechanism is not efficient for explaining such fast encounters in our simulations. For Vrel>Vesc,0, the star has most possibly been ejected from the cluster, which is explained in some scenarios by binary system interactions and black holes (e.g. Pichardo et al. 2012; Lind et al. 2015, see references therein).
5.2. Chemical distribution for probable ω Centauri members
Figure 4 shows VGRV vs. [Al/Fe], [Si/Fe], [Ti/Fe], [Ni/Fe], [Fe/H] and [Mg/Fe] for the 15 RAVE stars (orange symbols) and the whole RAVE sample (in gray bins), The distribution for the 15 stars found to most likely be debris from the ω Centauri progenitor clearly follows the ω Centauri chemical patterns, as observed for member stars within ω Centauri’s tidal radius (e.g., Johnson & Pilachowski 2010, and references therein). The heavy elements (Si and Ti) generally follow the typical enhancement of ~+0.3 dex found in the cluster population, and ω Centauri exhibits a complex history of chemical enrichment with an abundant metal-poor and intermediate population (e.g., Johnson & Pilachowski 2010). The extended enhancement in chemical abundances observed in our sample of 329 RAVE stars is not conclusive for selecting ω Centauri members from RAVE data; however, we have shown on the Toomre diagram of Fig. 1 that these stars follow the halo kinematics. It should be noted that ω Centauri spans ranges in all the analyzed abundance patterns that are similar to those of the Milky Way, so any similarity between these quantities is not very useful for confirming the origin of these stars.
5.3. Statistical significance
To establish the statistical significance of our results, we compared the Monte Carlo simulations (see Sect. 4) to five mock samples created using the Besançon Galaxy model (Robin et al. 2014). For each mock sample we chose 329 stars that randomly satisfy the selection criteria defined in Sect. 2, and the RAVE/UCAC4 selection bias (errors in radial velocities, proper motions and distances are added). The number of false positive are listed in Table 2.
Mock sample from Besançon Galaxy model (Robin et al. 2014).
We consider a high significance in our detection if  (2)where Ntrue = 15 (see text), and since we have five mock samples from Table 2, we take the average over all the samples (⟨ Nfalse ⟩ = 2.6), obtaining a mean and standard deviation (σfalse = 1.2) for these values. Then, we find a significance σsignificance = 10.33. Therefore, the number of stars reported in the present paper are σsignificance> 3 × σfalse compared to the mock sample. We can conclude that the methodology in Sect. 4 robustly shows that there is a statistically significant population of stars from the RAVE survey that is possibly ejected from ω Centauri.
6. Conclusion
We identified eight RAVE stars at galactic longitudes (240°<l< 360°) with [Fe/H] metallicities in the range –2.2 dex < [Fe/H] < −0.7 dex and with Galactic retrograde motion similar to that of ω Centauri, which could have had a close encounter with ω Centauri with a minimum approach dmin< 100 pc during the last 200 Myr in the past. Our numerical scheme suggests that these stars have been probably ejected from the cluster with a velocity Vejection< 200 km s-1, and their kinematic connection with ω Centauri makes them good candidates to be part of the predicted sequence of tidal streams in retrograde rotation left behind the cluster over time.
The probabilities we estimated may neglect some physical evolution of the orbit and/or internal structure of the ω Centauri progenitor, but the agreement with other results in the literature supports our conclusion that the eight RAVE stars reported in this study are candidates for being ω Centauri stellar debris.
We have also identified another group of seven stars having close encounters with ω Centauri; however, the high relative velocities Vrel> 200 km s-1 during the encounters make it unlikely that they have been ejected from ω Centauri.
The 314 other stars with retrograde orbits have a negligible probability of close encounters within 100 pc in 0.2 Gyr. We have classified this group of stars as less likely to have ties with ω Centauri. Their chemical distribution and Galactic retrograde rotation are similar to those of the inner Galactic halo.
We have not found an evident external structure beyond the tidal radius of the cluster from RAVE data on Galactic retrograde rotation.
In order to facilitate the reproducibility and reuse of our results, we have made all the orbit simulations in a public repository3 available.
Online material
Appendix A: Orbits in a non-axisymmetric Galactic model
We also ran the simulations in a non-axisymmetric galactic potential, in order to verify the bar effect in our results. The Galactic model that we considered is the analytical potential presented in Sect. 4, and the non-axisymmetric Galactic potential including a prolate bar given by Pichardo et al. (2004) to the galactic bar, with a total mass of ~1.6 × 10¹⁰M⊙ and angular velocity of ωB = 55 ± 5 km s-1 kpc-1 (e.g., Pichardo et al. 2012). Using the same considerations as in Sect. 4 to model the orbits of the RAVE stars and ω Centauri, 105 pairs of orbits were integrated to 0.2 Gyr in the past. Figures A.1 and A.2 show the results to the stars listed in Table 1; the probabilities of close encounters are similar in both Galactic potential, and the bar effects for integration time <0.2 Gyr, do not affect the results presented in this work.
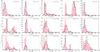 |
Fig. A.1 Relative velocity (Vrel) distribution for 105 pairs of orbits integrated backward in time over 0.2 Gyr in an axisymmetric (pink histograms) and non-axisymmetric potential (black histograms). |
ω Centauri candidates selected from RAVE catalog, their abundance ratios, and space velocities.
Uncertainties are considered as 1σ variations, and a Gaussian Monte Carlo sampling generates the parameters to compute the present-day positions and velocities of the ω Centauri and RAVE stars.
The probability is defined as Prob = Number of orbits having close encounters with the cluster/Ntotal, where Ntotal = 1 × 10⁵ Monte Carlo simulations.
Acknowledgments
J.G.F-T is currently supported by Centre National d’Études Spatiales (CNES) through PhD grant 0101973 and the Région de Franche-Comté and by the French Programme National de Cosmologie et Galaxies (PNCG). This research was supported by the Munich Institute for Astro- and Particle Physics (MIAPP) of the DFG cluster of excellence “Origin and Structure of the Universe”. J.G.F-T also thanks James Binney and George Kordopatis for discussions of this work during the “THE NEW MILKY WAY” workshop. F. Robles-Valdez is grateful to DGAPA-UNAM for the postdoctoral grant CJIC/CTIC/0903 and acknowledge the support from the CONACyT (grant 167625). We are grateful to an anonymous referee for a careful reading and many useful comments that significantly improved the final manuscript. Besançon Galaxy model simulations were executed on computers from the UTINAM Institute of the Université de Franche-Comté, supported by the Région de Franche-Comté and Institut des Sciences de l’Univers (INSU). Monte Carlo simulations were executed on computers from the Instituto de Astronomía-UNAM, México. Funding for RAVE has been provided by: the Australian Astronomical Observatory, the Leibniz-Institut fuer Astrophysik Potsdam (AIP), the Australian National University, the Australian Research Council, the French National Research Agency, the German Research Foundation (SPP 1177 and SFB 881), the European Research Council (ERC-StG 240271 Galactica), the Istituto Nazionale di Astrofisica at Padova, the Johns Hopkins University, the National Science Foundation of the USA (AST-0908326), the W. M. Keck foundation, the Macquarie University, the Netherlands Research School for Astronomy, the Natural Sciences and Engineering Research Council of Canada, the Slovenian Research Agency, the Swiss National Science Foundation, the Science & Technology Facilities Council of the UK, Opticon, Strasbourg Observatory and the Universities of Groningen, Heidelberg and Sydney. The RAVE web site is at http://www.rave-survey.org
References
- Allen, C., & Santillan, A. 1991, Rev. Mex. Astron. Astrofis., 22, 255 [NASA ADS] [Google Scholar]
- Anguiano, B., Zucker, D. B., Scholz, R.-D., et al. 2015, MNRAS, 451, 1229 [NASA ADS] [CrossRef] [Google Scholar]
- Bedin, L. R., Piotto, G., Anderson, J., et al. 2004, ApJ, 605, L125 [NASA ADS] [CrossRef] [Google Scholar]
- Bekki, K., & Freeman, K. C. 2003, MNRAS, 346, L11 [NASA ADS] [CrossRef] [Google Scholar]
- Bellini, A., Piotto, G., Bedin, L. R., et al. 2009, A&A, 507, 1393 [NASA ADS] [CrossRef] [EDP Sciences] [Google Scholar]
- Bellini, A., Bedin, L. R., Piotto, G., et al. 2010, AJ, 140, 631 [NASA ADS] [CrossRef] [Google Scholar]
- Boeche, C., Siebert, A., Williams, M., et al. 2011, AJ, 142, 193 [NASA ADS] [CrossRef] [Google Scholar]
- Brunthaler, A., Reid, M. J., Menten, K. M., et al. 2011, Astron. Nachr., 332, 461 [NASA ADS] [CrossRef] [Google Scholar]
- Da Costa, G. S. 2012, ApJ, 751, 6 [NASA ADS] [CrossRef] [Google Scholar]
- Da Costa, G. S., & Coleman, M. G. 2008, AJ, 136, 506 [NASA ADS] [CrossRef] [Google Scholar]
- Dinescu, D. I., Girard, T. M., & van Altena, W. F. 1999, AJ, 117, 1792 [NASA ADS] [CrossRef] [Google Scholar]
- Fernández-Trincado, J. G., Vivas, A. K., Mateu, C. E., & Zinn, R. 2013, Mem. Soc. Astron. Italiana, 84, 265 [Google Scholar]
- Fernández-Trincado, J. G., Vivas, A. K., Mateu, C. E., et al. 2015, A&A, 574, A15 [NASA ADS] [CrossRef] [EDP Sciences] [Google Scholar]
- Freeman, K. C., & Rodgers, A. W. 1975, ApJ, 201, L71 [NASA ADS] [CrossRef] [Google Scholar]
- Gnedin, O. Y., Zhao, H., Pringle, J. E., et al. 2002, ApJ, 568, L23 [NASA ADS] [CrossRef] [Google Scholar]
- Harris, W. E. 1996, AJ, 112, 1487 [NASA ADS] [CrossRef] [Google Scholar]
- Hawkins, K., Kordopatis, G., Gilmore, G., et al. 2015, MNRAS, 447, 2046 [NASA ADS] [CrossRef] [Google Scholar]
- Hilker, M., Kayser, A., Richtler, T., & Willemsen, P. 2004, A&A, 422, L9 [NASA ADS] [CrossRef] [EDP Sciences] [Google Scholar]
- Hughes, J., & Wallerstein, G. 2000, AJ, 119, 1225 [NASA ADS] [CrossRef] [Google Scholar]
- Ideta, M., & Makino, J. 2004, ApJ, 616, L107 [NASA ADS] [CrossRef] [Google Scholar]
- Johnson, C. I., & Pilachowski, C. A. 2010, ApJ, 722, 1373 [NASA ADS] [CrossRef] [Google Scholar]
- Johnson, D. R. H., & Soderblom, D. R. 1987, AJ, 93, 864 [NASA ADS] [CrossRef] [Google Scholar]
- Kordopatis, G., Gilmore, G., Steinmetz, M., et al. 2013, AJ, 146, 134 [NASA ADS] [CrossRef] [Google Scholar]
- Kunder, A., Bono, G., Piffl, T., et al. 2014, A&A, 572, A30 [NASA ADS] [CrossRef] [EDP Sciences] [Google Scholar]
- Law, D. R., Majewski, S. R., Skrutskie, M. F., Carpenter, J. M., & Ayub, H. F. 2003, AJ, 126, 1871 [NASA ADS] [CrossRef] [Google Scholar]
- Lee, Y.-W., Joo, J.-M., Sohn, Y.-J., et al. 1999, Nature, 402, 55 [NASA ADS] [CrossRef] [Google Scholar]
- Leon, S., Meylan, G., & Combes, F. 2000, A&A, 359, 907 [NASA ADS] [Google Scholar]
- Lind, K., Koposov, S. E., Battistini, C., et al. 2015, A&A, 575, L12 [NASA ADS] [CrossRef] [EDP Sciences] [Google Scholar]
- Majewski, S. R., Patterson, R. J., Dinescu, D. I., et al. 2000, in Liège Int. Astrophys. Colloq., 35, eds. A. Noels, P. Magain, D. Caro, et al., 619 [Google Scholar]
- Majewski, S. R., Nidever, D. L., Smith, V. V., et al. 2012, ApJ, 747, L37 [NASA ADS] [CrossRef] [Google Scholar]
- Marconi, M., Musella, I., Di Criscienzo, M., et al. 2014, MNRAS, 444, 3809 [NASA ADS] [CrossRef] [Google Scholar]
- Meza, A., Navarro, J. F., Abadi, M. G., & Steinmetz, M. 2005, MNRAS, 359, 93 [NASA ADS] [CrossRef] [Google Scholar]
- Mizutani, A., Chiba, M., & Sakamoto, T. 2003, ApJ, 589, L89 [NASA ADS] [CrossRef] [Google Scholar]
- Moriya, T., & Shigeyama, T. 2010, Phys. Rev. D, 81, 043004 [NASA ADS] [CrossRef] [Google Scholar]
- Navarrete, C., ContrerasRamos, R., Catelan, M., et al. 2015, A&A, 577, A99 [NASA ADS] [CrossRef] [EDP Sciences] [Google Scholar]
- Nissen, P. E., & Schuster, W. J. 2010, A&A, 511, L10 [NASA ADS] [CrossRef] [EDP Sciences] [Google Scholar]
- Norris, J. E., Freeman, K. C., Mayor, M., & Seitzer, P. 1997, ApJ, 487, L187 [NASA ADS] [CrossRef] [Google Scholar]
- Pancino, E., Seleznev, A., Ferraro, F. R., Bellazzini, M., & Piotto, G. 2003, MNRAS, 345, 683 [NASA ADS] [CrossRef] [Google Scholar]
- Pichardo, B., Martos, M., & Moreno, E. 2004, ApJ, 609, 144 [NASA ADS] [CrossRef] [Google Scholar]
- Pichardo, B., Moreno, E., Allen, C., et al. 2012, AJ, 143, 73 [NASA ADS] [CrossRef] [Google Scholar]
- Robin, A. C., Reylé, C., Fliri, J., et al. 2014, A&A, 569, A13 [NASA ADS] [CrossRef] [EDP Sciences] [Google Scholar]
- Romano, D., Matteucci, F., Tosi, M., et al. 2007, MNRAS, 376, 405 [NASA ADS] [CrossRef] [Google Scholar]
- Ross, D. J., Mennim, A., & Heggie, D. C. 1997, MNRAS, 284, 811 [NASA ADS] [CrossRef] [Google Scholar]
- Sollima, A., Ferraro, F. R., Bellazzini, M., et al. 2007, ApJ, 654, 915 [NASA ADS] [CrossRef] [Google Scholar]
- Sollima, A., Bellazzini, M., Smart, R. L., et al. 2009, MNRAS, 396, 2183 [NASA ADS] [CrossRef] [Google Scholar]
- Tsuchiya, T., Dinescu, D. I., & Korchagin, V. I. 2003, ApJ, 589, L29 [NASA ADS] [CrossRef] [Google Scholar]
- Tsuchiya, T., Korchagin, V. I., & Dinescu, D. I. 2004, MNRAS, 350, 1141 [NASA ADS] [CrossRef] [Google Scholar]
- Valcarce, A. A. R., & Catelan, M. 2011, A&A, 533, A120 [NASA ADS] [CrossRef] [EDP Sciences] [Google Scholar]
- Wylie-de Boer, E., Freeman, K., & Williams, M. 2010, AJ, 139, 636 [NASA ADS] [CrossRef] [Google Scholar]
- Zacharias, N., Finch, C. T., Girard, T. M., et al. 2013, AJ, 145, 44 [NASA ADS] [CrossRef] [EDP Sciences] [Google Scholar]
- Zhao, H. 2004, MNRAS, 351, 891 [NASA ADS] [CrossRef] [Google Scholar]
All Tables
Derived ejection parameters for the 15 RAVE stars more likely to have close encounters with ω Centauri.
ω Centauri candidates selected from RAVE catalog, their abundance ratios, and space velocities.
All Figures
|
Fig. 1 Toomre diagram for RAVE stars and their simulation with the Besançon Galaxy model. RAVE stars with quality control cuts (see Sect. 2) are shown in gray dots. ω Centauri is shown with the green symbol. Isocontours refers to thin-disk (green), young thick-disk (black dashed), old thick-disk (magenta) and halo (cyan) simulated RAVE stars. Orange symbols (8 stars) with error bars correspond to RAVE stars that have a high probability of encountering ω Centauri and relative velocity Vrel< 200 km s-1 (see Sect. 5), and red dots (314 stars) correspond to halo stars having a negligible probability (<0.01%) of encountering ω Centauri (see Sect. 4). The vertical dashed line indicates zero Galactic rotation. (A color version of this figure is available in the online journal.) |
| In the text | |
|
Fig. 2 RAVE stars in the Galactocentric radial velocity (VGRV) vs. Galactic longitude space. The top panel refers to RAVE data, the middle and bottom panels refer to Besançon-galaxy model-simulated RAVE data. ω Centauri is shown with the green cross. Majewski et al. (2012) stellar “streams” are plotted with blue symbols. Probable members found in this work are represented by orange symbols and are the same as in Fig. 1 with their size proportional to the probability of close encounter with the cluster (see Sect. 4), and RAVE halo stars having a negligible probability of encountering with ω Centauri are shown with red dots. The black contours show the full RAVE sample and simulations, respectively. The colored contours refers to the Galactic components from the simulation as in Fig. 1. The gray scale refers to the logarithm of the number of stars in it, as indicated by the color bar. (A color version of this figure is available in the online journal.) |
| In the text | |
|
Fig. 3 Orbit projection in the potential axisymmetric for “J131340.4−484714” (blue line) and ω Centauri (red line) in X,Y Galactic coordinates on the Galactic plane. The solar position is (X⊙, Y⊙, Z⊙) = (8.3, 0, 0) kpc in t = 0 Gyr. The solid curves show the orbits integrated backwards from initial position in t = 0 Gyr (open symbols) to τenc = 0.2 Gyr (filled symbols) that have a close encounter with dmin< 100 pc. (A color version of this figure is available in the online journal.) |
| In the text | |
|
Fig. 4 2D density plot for [X/H] and VGRV in the Galactic longitude range 240°<l< 360°. The orange and red symbols are the same as in Fig. 1. The cyan dots refer to ω Centauri members from Johnson & Pilachowski (2010). (A color version of this figure is available in the online journal.) |
| In the text | |
|
Fig. 5 Distribution of relative velocities (Vrel) during close encounters for the whole integration time, t = 1 Gyr (pink histograms), and t< 0.2 Gyr (black histograms). (A color version of this figure is available in the online journal.) |
| In the text | |
|
Fig. 6 davg distributions, defined as the average distance between pairs of orbits through the Galaxy from the present time (or t = 0 Gyr) until the close encounter time (τenc). The pink distribution refers to the whole integration time (1 Gyr), and the black distribution refers to close encounters with relative velocities within 0.2 Gyr and 100 pc distance. (A color version of this figure is available in the online journal.) |
| In the text | |
|
Fig. A.1 Relative velocity (Vrel) distribution for 105 pairs of orbits integrated backward in time over 0.2 Gyr in an axisymmetric (pink histograms) and non-axisymmetric potential (black histograms). |
| In the text | |
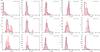 |
Fig. A.2 davg distribution. The pink and red histograms are the same as in Fig. A.1. |
| In the text | |
Current usage metrics show cumulative count of Article Views (full-text article views including HTML views, PDF and ePub downloads, according to the available data) and Abstracts Views on Vision4Press platform.
Data correspond to usage on the plateform after 2015. The current usage metrics is available 48-96 hours after online publication and is updated daily on week days.
Initial download of the metrics may take a while.