Fig. 2
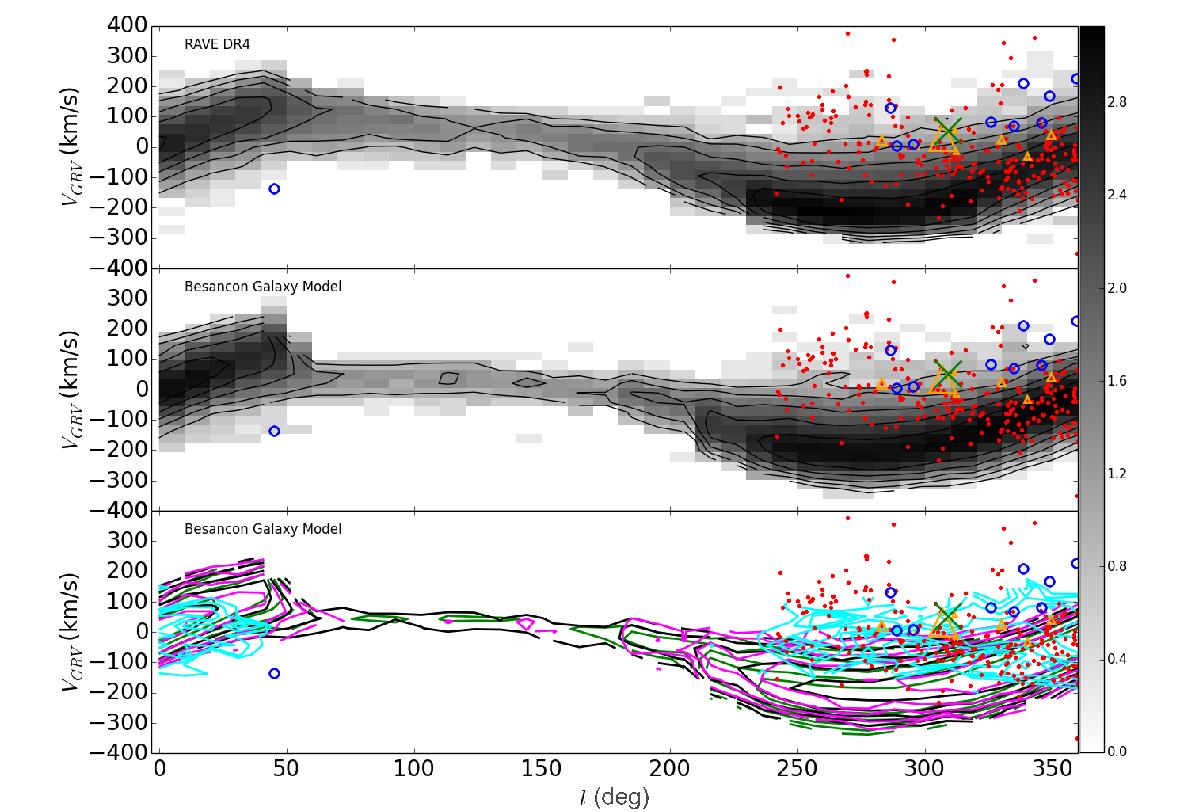
RAVE stars in the Galactocentric radial velocity (VGRV) vs. Galactic longitude space. The top panel refers to RAVE data, the middle and bottom panels refer to Besançon-galaxy model-simulated RAVE data. ω Centauri is shown with the green cross. Majewski et al. (2012) stellar “streams” are plotted with blue symbols. Probable members found in this work are represented by orange symbols and are the same as in Fig. 1 with their size proportional to the probability of close encounter with the cluster (see Sect. 4), and RAVE halo stars having a negligible probability of encountering with ω Centauri are shown with red dots. The black contours show the full RAVE sample and simulations, respectively. The colored contours refers to the Galactic components from the simulation as in Fig. 1. The gray scale refers to the logarithm of the number of stars in it, as indicated by the color bar. (A color version of this figure is available in the online journal.)
Current usage metrics show cumulative count of Article Views (full-text article views including HTML views, PDF and ePub downloads, according to the available data) and Abstracts Views on Vision4Press platform.
Data correspond to usage on the plateform after 2015. The current usage metrics is available 48-96 hours after online publication and is updated daily on week days.
Initial download of the metrics may take a while.