| Issue |
A&A
Volume 583, November 2015
|
|
|---|---|---|
| Article Number | A76 | |
| Number of page(s) | 10 | |
| Section | Galactic structure, stellar clusters and populations | |
| DOI | https://doi.org/10.1051/0004-6361/201526575 | |
| Published online | 30 October 2015 | |
Online material
Appendix A: Orbits in a non-axisymmetric Galactic model
We also ran the simulations in a non-axisymmetric galactic potential, in order to verify the bar effect in our results. The Galactic model that we considered is the analytical potential presented in Sect. 4, and the non-axisymmetric Galactic potential including a prolate bar given by Pichardo et al. (2004) to the galactic bar, with a total mass of ~1.6 × 10¹⁰M⊙ and angular velocity of ωB = 55 ± 5 km s-1 kpc-1 (e.g., Pichardo et al. 2012). Using the same considerations as in Sect. 4 to model the orbits of the RAVE stars and ω Centauri, 105 pairs of orbits were integrated to 0.2 Gyr in the past. Figures A.1 and A.2 show the results to the stars listed in Table 1; the probabilities of close encounters are similar in both Galactic potential, and the bar effects for integration time <0.2 Gyr, do not affect the results presented in this work.
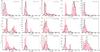 |
Fig. A.1
Relative velocity (Vrel) distribution for 105 pairs of orbits integrated backward in time over 0.2 Gyr in an axisymmetric (pink histograms) and non-axisymmetric potential (black histograms). |
| Open with DEXTER | |
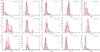 |
Fig. A.2
davg distribution. The pink and red histograms are the same as in Fig. A.1. |
| Open with DEXTER | |
ω Centauri candidates selected from RAVE catalog, their abundance ratios, and space velocities.
© ESO, 2015
Current usage metrics show cumulative count of Article Views (full-text article views including HTML views, PDF and ePub downloads, according to the available data) and Abstracts Views on Vision4Press platform.
Data correspond to usage on the plateform after 2015. The current usage metrics is available 48-96 hours after online publication and is updated daily on week days.
Initial download of the metrics may take a while.