Fig. 6
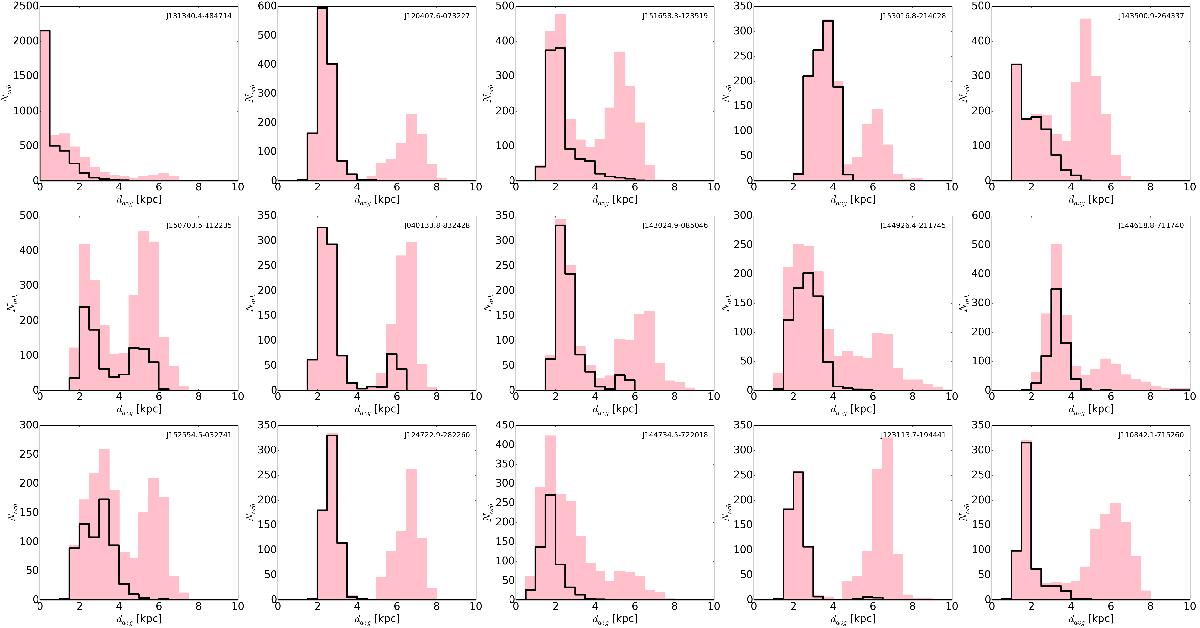
davg distributions, defined as the average distance between pairs of orbits through the Galaxy from the present time (or t = 0 Gyr) until the close encounter time (τenc). The pink distribution refers to the whole integration time (1 Gyr), and the black distribution refers to close encounters with relative velocities within 0.2 Gyr and 100 pc distance. (A color version of this figure is available in the online journal.)
Current usage metrics show cumulative count of Article Views (full-text article views including HTML views, PDF and ePub downloads, according to the available data) and Abstracts Views on Vision4Press platform.
Data correspond to usage on the plateform after 2015. The current usage metrics is available 48-96 hours after online publication and is updated daily on week days.
Initial download of the metrics may take a while.