| Issue |
A&A
Volume 583, November 2015
|
|
|---|---|---|
| Article Number | A58 | |
| Number of page(s) | 9 | |
| Section | Planets and planetary systems | |
| DOI | https://doi.org/10.1051/0004-6361/201526453 | |
| Published online | 27 October 2015 | |
Nebular dead zone effects on the D/H ratio in chondrites and comets
1
Institut UTINAM, CNRS-UMR 6213, Observatoire de Besançon, Université de
Franche-Comté,
BP 1615,
25010
Besançon Cedex,
France
e-mail: This email address is being protected from spambots. You need JavaScript enabled to view it.
2
Department of Physics and Astronomy, University of
Nevada, Las Vegas, 4505 South
Maryland Parkway, Las
Vegas, NV
89154,
USA
3
Aix Marseille Université, CNRS, LAM (Laboratoire d’Astrophysique
de Marseille) UMR 7326, 13388
Marseille,
France
4
Center for Radiophysics and Space Research, Space Sciences
Building, Cornell University, Ithaca, NY
14853,
USA
Received: 2 May 2015
Accepted: 30 July 2015
Abstract
Context. Comets and chondrites show non-monotonic behavior of their deuterium-to-hydrogen (D/H) ratio as a function of their formation location from the Sun. This is difficult to explain with a classical protoplanetary disk model that has a decreasing temperature structure with radius from the Sun.
Aims. We want to understand if a protoplanetary disc with a dead zone, i.e., a region of zero or low turbulence, can explain the measured D/H values in comets and chondrites.
Methods. We use time snapshots of a vertically layered disk model with turbulent surface layers and a dead zone at the midplane. The disc has a non-monotonic temperature structure due to increased heating from self-gravity in the outer parts of the dead zone. We couple this to a D/H ratio evolution model in order to quantify the effect of such thermal profiles on D/H enrichment in the nebula.
Results. We find that the local temperature peak in the disk can explain the diversity in the D/H ratios of different chondritic families. This disk temperature profile leads to a non-monotonic D/H enrichment evolution, allowing these families to acquire their different D/H values while forming in close proximity. The formation order we infer for these families is compatible with that inferred from their water abundances. However, we find that even for very young disks, the thermal profile reversal is too close to the Sun to be relevant for comets.
Key words: protoplanetary disks / astrochemistry / meteorites, meteors, meteoroids / planets and satellites: composition / comets: general
© ESO, 2015
1. Introduction
The deuterium-to-hydrogen (D/H) ratio is one of the most discussed isotopic ratios in planetary sciences. This interest is due to the strong dependence the ratio has on the temperature of an icy body’s formation location (Ceccarelli et al. 2014). In the interstellar medium (ISM), the water D/H ratio is measured at up to ~9 × 10⁻⁴ (Brown & Millar 1989), although the values are much higher in the organic matter of the interstellar hot cores (~1 × 10⁻³) and cold clouds (up to ~2 × 10⁻²) (Dartois et al. 2003; Robert 2006; Parise et al. 2012). When a protoplanetary disk forms around a young star, these ices are heated to more than a few hundred K. At these high temperatures, gaseous HDO reacts with nebular H2 to form water vapor and HD,  (1)and this results in a decrease in the D/H ratio in water because [HD]/[H2] is lower than D/H in water, even accounting for chemical affinity (Lécluse & Robert 1994). The rate of this reaction depends strongly on the disk temperature. Therefore, ices forming in regions with higher past temperatures should have a lower D/H ratio. Measurements of D/H in Jupiter and Saturn find D/H ~2 × 10⁻⁵ (Lellouch et al. 2001), the value also found in the ISM hydrogen gas. This value is usually interpreted as the D/H ratio in the protosolar nebula’s H2. For the rest of this work we follow Drouart et al. (1999) and others in defining f as the D/H enrichment factor in water:
 ![Mathematical equation: \begin{eqnarray} f=\frac{{\rm [HDO]/[H_2O]}}{{\rm [HD]/[H_2]}} \cdot \end{eqnarray}](/articles/aa/full_html/2015/11/aa26453-15/aa26453-15-eq9.png) (2)Thus, for the nebular H2 gas, by definition, f is equal to unity.
(2)Thus, for the nebular H2 gas, by definition, f is equal to unity.
1.1. D/H ratio observations in the solar system
Measured water D/H fractionation and abundance in small bodies in the solar system.
The water D/H ratio of small bodies in the solar system has been measured for a large number of comets (Mumma & Charnley 2011), meteorites (Robert 2006), and in the plumes of Saturn’s moon Enceladus (Waite et al. 2009; Spencer et al. 2009). In meteorites, organic materials and water both contribute to the bulk D/H value. Therefore, separating the two components is crucial to understanding the contribution from water. This was done by Alexander et al. (2012), who found f values ranging from 3 to 5 in carbonaceous CI chondrites, and ~15 in ordinary chondrites (OCs). More recently, a higher value reaching f ~ 100 has been also inferred for OCs (Piani et al. 2015). This implies that either low D/H minerals still coexist in the matrix mixed with deuterium-rich organics, or an unknown process has fractionated water and organics differently from an initial low D/H reservoir before their incorporation in the matrix. In neither case have the low values for the D/H ratio obtained from this method ever existed in chondrites. Taken at face value, these results contradict the predictions from the expected formation locations, since CIs are usually associated with C-complex asteroids that formed between the giant planets, and OCs are associated with S-complex asteroids that formed in situ sunward of Jupiter’s orbit (Chapman 1996; Mothé-Diniz et al. 2003; Walsh et al. 2011). Alexander et al. (2010) noted, however, that due to hydrogen escape via Fe oxidation, the D/H ratio in OCs should be treated as an upper value and could originally have been much lower. This effect was found to be limited to OCs, allowing us to use the values measured in other chondritic families to understand the processes at play.
The carbonaceous CR chondrites are thought to have a high D/H value (Robert & Epstein 1982). The value measured by Alexander et al. (2012) of f ~ 8 is very surprising, since this is almost twice the value in CIs, and is actually higher than that found in the comet 103P/Hartley. The D/H ratio was also measured in the ordinary chondrites of type LL3 and found to be even higher than that in L- and H-type ordinary chondrites (Robert 2006; Alexander et al. 2010). Measurements of the D/H ratio in the carbonaceous chondrite types CO, CM, and CV were also found to be low providing further evidence for this discrepancy in the carbonaceous and ordinary chondrite D/H ratios (Robert 2006; Alexander et al. 2012).
In Oort cloud comets (OCCs), classically thought to have formed between the giant planets, f was found to range between 10 and 25. On the other hand, the D/H ratio was measured for the first time in the Jupiter family comet (JFC) 103P/Hartley, a family classically thought to have formed in the Kuiper belt beyond Neptune, and was found to be ~7.4, the value also found in the Earth’s oceans (Hartogh et al. 2011). This was surprising since JFCs are thought to have formed in an area farther out than the OCCs (Morbidelli 2008) (although compare the model of Brasser & Morbidelli 2013, where all comets form beyond the orbital radius of Neptune); it was predicted that their D/H ratio should be higher than or at least equal to that of the OCCs (Mousis et al. 2000; Kavelaars et al. 2011). What made the situation even murkier is the recent measurement of the D/H ratio in the JFC 67P/Churyumov-Gerasimenko by Rosetta where the value found lies well within the OCC range (Altwegg et al. 2015). A summary of all of the D/H ratio observations discussed here, and the water abundances in chondrites, can be found in Table 1.
1.2. D/H ratio connection to protoplanetary disc models
Classical disk models with a standard monotonically decreasing temperature profile (Lynden-Bell & Pringle 1974; Pringle 1981) all predict that the D/H ratio should similarly follow a monotonic profile, increasing with the icy body’s formation distance from the Sun (Drouart et al. 1999; Mousis et al. 2000; Hersant et al. 2001). An alternative model is that of Yang et al. (2013) who use a new D/H 2D model including the infalling material from the cloud, giving a non-monotonic D/H ratio profile in the nebula due to constant influx of unequilibrated water. However, they did not discuss the D/H ratio in chondrites, and their monotonic temperature profile out to a radius of 10 AU cannot explain the diversity of D/H ratios found in the inner solar system. Another model is that of Jacquet & Robert (2013), who tried to explain the chondritic diversity with a classical disc model that includes an interplay of inward advection and outward diffusion in the nebula. This model, however, also predicted a monotonic D/H profile, and although it can broadly explain the chondrite D/H range, it does not explain, for example, why CRs, which formed closer to the Sun than CIs (Wood 2005), have a higher D/H ratio.
The observed D/H fractionation variations found in chondrites are a challenge to classical disk models since the parent bodies of most chondrites should have formed in the same general region, except those of CIs that probably formed a few AU farther out in the disk. All these results indicate that either the D/H evolution models used are incomplete or that the thermal profile in the protosolar nebula was not monotonic, the hypothesis we are going to explore in this work.
Turbulence within protoplanetary disks drives outward angular momentum transport that allows material to spiral in and be accreted onto the forming star (e.g., Pringle 1981). This turbulence is thought to be driven by the magneto-rotational instability (MRI; Balbus & Hawley 1991). However, it is now generally accepted that the midplanes of protoplanetary disks have a region of zero or weak turbulence known as a “dead zone” (e.g., Gammie 1996; Fromang et al. 2002; Martin et al. 2012a; Dzyurkevich et al. 2013; Turner et al. 2014; Cleeves et al. 2015). This leads to a gradual accumulation of gas in the dead zone region, resulting in an increase in the temperature and pressure (Armitage et al. 2001; Zhu et al. 2010; Martin & Lubow 2011, 2013). The increased surface density of the disc can lead to a second type of turbulence, driven by gravitational instability (Paczynski 1978; Lodato & Rice 2004) and this results in an increase in the temperature locally in that region. The question we are going to tackle in this work is: what effect does a local peak in the temperature have on the D/H ratio in protoplanetary disks, and can it resolve the discrepancies in the observations of the D/H ratio in small bodies in our solar system? In Sect. 2 we discuss the model we use to simulate the processes involved. In Sect. 3 we discuss the results and implications. We draw our conclusions in Sect. 4.
2. The numerical model
2.1. The protoplanetary disk model
We follow Martin & Lubow (2011) and model the protoplanetary disc as a layered accretion disc (see their Eqs. (1)–(16)). The surface density evolves according to conservation of mass and angular momentum (Pringle 1981). The temperature structure is governed by a simplified energy equation that balances viscous heating with blackbody cooling (see, e.g., Pringle et al. 1986; Canizzo 1993). There are two types of turbulence in protoplanetary discs, magnetic turbulence driven by the MRI and gravitational turbulence (Paczynski 1978).
The MRI requires a critical level of ionization to operate so that the gas is closely coupled to the magnetic field. This can be achieved if the temperature of the disc is higher than the critical T>Tcrit = 800 K (Umebayashi 1983). In this case, the MRI operates at all disc heights. However, the temperature in the outer parts of the disc is lower than this. In this region, the disc surface layers may be ionized by external sources of ionization such as cosmic rays or X-rays from the central star to a maximum surface density depth of Σcrit = 200 g cm-2 (e.g., Gammie 1996; Glassgold et al. 2004). If the total surface density of the disc is higher than this, Σ > Σcrit, then there is a dead zone at the midplane with surface density Σd = Σ−Σcrit and the active layers have Σa = Σcrit. Otherwise, if Σ < Σcrit, then there is no dead zone layer so that Σd = 0 and Σa = Σ.
The MRI active layers have a Shakura & Sunyaev (1973) viscosity α parameter of 0.01 (e.g., Hartmann et al. 1998). In our model, the dead zone has zero turbulence, unless it becomes self-gravitating. Turbulence in the dead zone could be driven by other sources such as hydrodynamic instabilities (including the baroclinic instability, Klahr & Bodenheimer 2003; Petersen et al. 2007; Lesur & Ogilvie 2010) or be induced from the magnetohydrodynamic instability in the active surface layers (Fleming & Stone 2003; Simon et al. 2011; Gressel et al. 2012). However, we note that a small amount of turbulence within the dead zone does not significantly alter the qualitative disk structure and behavior (Martin & Lubow 2014). The conclusions of our work are not significantly affected by an additional source of turbulence within the dead zone, unless the source is strong enough to be able to produce a steady state disk. This would require a level of turbulence comparable to that produced by MRI (Martin & Lubow 2014). We discuss the uncertainties associated with the α parameter in Sect. 3.5.
Gravitational turbulence requires the Toomre (1964) parameter to be less than the critical, Q<Qcrit = 2. While a dead zone is present in a protoplanetary disc, the flow through the disc is not steady because material accumulates in the dead zone. With sufficient material in the dead zone, it may become self gravitating, thus a small amount of turbulence may be driven. We include an additional viscous term in the surface density evolution equation and a heating term in the temperature equation. This extra heating in the massive dead zone can eventually cause the disc to reach the critical temperature required for the MRI. Once this is reached, there is a snow plough effect through the disc and the whole disc becomes MRI active in an outburst phase (Martin & Lubow 2013). As material drains on the star, the disc cools and the dead zone can re-form causing repeating outburst and quiescent cycles. Once the infall accretion rate onto the disc drops off, there may not be sufficient inflow through the disc for another outburst to occur, but there can still be a dead zone within the disc.
The infall accretion rate onto a forming star varies over time, although the details of the evolution depends on the specific disc model (e.g., Shu 1977; Basu 1998; Bate 2011; Kratter et al. 2008). However, it is thought that at early times the infall accretion rate is approximately  . Thus, assuming a cloud temperature T ~ 10 K, the initial infall accretion rate is ~10-5 M⊙ yr-1. In this work, we consider several constant infall rates and thus analyze the disc structure at different evolutionary times. We choose three infall accretion rates onto the disc of Ṁinfall = 2 × 10⁻⁵, 1 × 10⁻⁶, and 1 × 10⁻⁸ M⊙ yr-1.
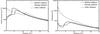 |
Fig. 1 Disk surface density (left panel) and temperature (right panel) structure for the high infall accretion rate Ṁinfall = 2 × 10⁻⁵ M⊙ yr-1. The profiles are shown just before, during, and just after an accretion outburst. The “during outburst” profile is used in the calculations corresponding to Fig. 4. |
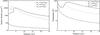 |
Fig. 2 Disk surface density (left panel) and temperature (right panel) for Ṁinfall = 2 × 10⁻⁵ M⊙ yr-1 (at a time just before an outburst), 10-6 M⊙ yr-1 (at a time between outbursts), and Ṁinfall = 10-8M⊙ yr-1 (in steady state). The thermal gradient reversal observable in the right panel is the main element of the disk model. We use Ṁinfall = 1 × 10⁻⁶ M⊙ yr-1 as our nominal disk model. |
We solve the accretion disc equations with 200 grid points spaced equally in log R. For each infall accretion rate, we run the model until the disc reaches either a steady outburst cycle (for the two highest accretion rates), or a steady state (fully MRI active) disc solution (for the lowest accretion rate). These models represent different stages of the disc evolution. In Fig. 1 we show the surface density and temperature profiles for the disc as a function of radius at three different times for Ṁinfall = 2 × 10⁻⁵ M⊙ yr-1. The first is a time immediately before an outburst, the second is during the outburst, and the third is immediately after the outburst. During this early phase of the disc evolution, the timescale between the outbursts is only 3 × 10³ yr. As we expect the accretion rate on to the disc to decrease exponentially over time, the timescale between the outbursts increases during the disc lifetime (see, e.g., Martin et al. 2012b). Furthermore, the radius of the temperature peak (the radius at which the disc becomes self-gravitating) moves inward over time (Martin & Lubow 2013). In Fig. 2 we show the surface density and temperature profiles corresponding to the different disk stages and infall accretion rates. For high accretion rates, the local thermal peak is present in the disk, and disappears for Ṁinfall ~ 1 × 10⁻⁸ M⊙ yr-1 because there is no dead zone at this low accretion rate. The model behaves as a classical accretion disk without a dead zone (for a comparison see, e.g., Baillié et al. 2015, who found temperature and surface density profiles comparable to the model we use for a similar accretion rate value). The position of the thermal peak is also sensitive to the infall accretion rate. The model with Ṁinfall = 1 × 10⁻⁶ M⊙ yr-1 is used as the nominal disk model in this work, and this corresponds to the model used in Martin & Lubow (2013). We note that there is some uncertainty in the value of Σcrit such that it could be much smaller, which would mean that the temperature peak would exist for even lower accretion rates (see Sect. 3.5 for more on this point).
2.2. The D/H evolution model
Dust and grains in the protoplanetary disk settle to the disc midplane within the dead zone layer as there is little or no turbulence there. Thus, we expect that the solar systems bodies formed in the dead zone layer. We couple the protoplanetary disk profiles to a classical 1D D/H ratio evolution model. The D/H ratio in the dead zone layer is assumed to follow  (3)(Drouart et al. 1999), where k(T) is the rate of isotopic exchange, P is the gas pressure, A(T) is the fractionation at equilibrium, and Σd is the gas surface density in the dead zone layer. The turbulent diffusivity is
  (4)where νd is gas viscosity in the dead zone layer and Pr the Prandtl number. The parameter VR is the radial gas velocity:
  (5)(Pringle 1981). This equation is valid in the midplane dead zone layer assuming that Σd ≫ Σa, which is satisfied in the disk profiles that we use (see Sect. 3.5 for caveats). The viscosity due to the self-gravity in the dead zone layer is given by
  (6)where αd is the turbulence parameter. Throughout this work αd, Σd, and νd are the parameters in the midplane (MRI inactive dead zone), and not the value in the MRI active disk surface. The parameter Cs is the speed of sound and Ω the gas Keplerian velocity. The sound speed is calculated with the midplane disc temperature profile. In this disk model, αd is zero unless the disc locally satisfies Q<Qcrit, and then we have
 ![Mathematical equation: \begin{eqnarray} \alpha_{\rm d}= \begin{cases} \alpha \left[\left(\frac{Q_{\rm crit}}{Q} \right)^2-1 \right] & {\rm if}\,\,\, Q<Q_{\rm crit} \\ 0 & {\rm otherwise }\\ \end{cases} \label{ad} \end{eqnarray}](/articles/aa/full_html/2015/11/aa26453-15/aa26453-15-eq59.png) (7)(Martin & Lubow 2011). We note that if we were to include an additional source of visosity within the dead zone other than self-gravity, then we would add an additional term to this equation (see Martin & Lubow 2014). Figure 3 shows the viscosity parameter in the dead zone for the two highest disk infall accretion rates that we consider. This viscosity in the dead zone is much smaller than that in the active layers.
(7)(Martin & Lubow 2011). We note that if we were to include an additional source of visosity within the dead zone other than self-gravity, then we would add an additional term to this equation (see Martin & Lubow 2014). Figure 3 shows the viscosity parameter in the dead zone for the two highest disk infall accretion rates that we consider. This viscosity in the dead zone is much smaller than that in the active layers.
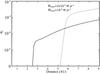 |
Fig. 3 Dead zone midplane turbulent viscosity parameter αd. If the disc is not self-graviting (i.e., Q>Qcrit), then αd = 0. Otherwise, its value is depicted by Eq. (7). We note that we manually smooth the viscosity variation (hence αd) over five grid points to avoid code divergence. For Ṁinfall = 10-6 M⊙ yr-1 the smoothing is between 2.2 and 2.5 AU and for Ṁinfall = 2 × 10⁻⁵ M⊙ yr-1 between 5.2 and 5.5 AU. |
The first term on the right side of Eq. (3) describes the chemical isotopic exchange between HDO and H2, and takes the pressure and temperature of the disk as the input. The second term describes the gas diffusion due to turbulence that depends on α and Σ. The third term describes the gas advection that is dependent on α, Σ, and VR. In contrast with previous models, we do not neglect this term and we solve the entire equation. The effect of a temperature peak in the nebula in our model is thus controlled by the interplay of these terms. In the absence of turbulence, the first term dominates and the effect of the temperature peak is to decrease the local D/H ratio. However, if the turbulence is strong enough, the diffusion and advection terms erase this gradient. We run all simulations with k(T) and A(T) from (Lécluse & Robert 1994), and set Pr to 0.5 (Prinn 1990; Dubrulle & Frisch 1991) (although we note that any value of order unity will lead to qualitatively similar results).
An explicit forward-time centered-space (FTCS) scheme was first used to solve this equation. During tests in the case of a regular monotonic thermal profile, the code converged if a sufficiently small time step was used. When the new thermal profiles (with temperature gradient reversals) were used the code diverged even for very small time steps, except for almost vanishing turbulence. Thus, we employ semi-implicit (Crank-Nicholson) and fully implicit schemes to solve the equation over the same grid used in the disk model, but we take the water snow line (the radial location in the disc inside of which water is gaseous and outside is solid) that occurs at a temperature of around Tsnow = 170 K (Lecar 2006) as the outer boundary, since the deuterium exchange can occur only in the vapor phase.
3. Results and discussions
Most simulations in the literature begin with a spatially constant f = 25, which is close to the highest value observed today in the solar system of 29–44 in LL3 meteorites (except Semarkona where a possible value of up to 100 was recently inferred Piani et al. 2015). However, since we are interested in the D/H ratio difference between two bodies rather than the absolute values, we begin our standard simulations with f0 = 15, which is the average value found in comets. The model evolves from this value and we check the effect of the thermal gradient reversal on the D/H ratio profile. We are therefore implicitly assuming that another transient heating process decreases the initially very high (LL3 or even interstellar) D/H ratios to the lower values we are using as the initial condition. A possible process for this is the gravo-magneto disc instability (Martin & Lubow 2011) and its associated accretion outburst that we first test here (see also Owen & Jacquet 2015). The accretion outburst occurs when the local peak in the temperature profile becomes high enough and reaches the critical temperature, Tcrit, required to trigger the MRI in the dead zone. During the outburst the disc becomes MRI active throughout and a large amount of material is accreted onto the Sun in a short time. After the outburst, the disk cools, the dead zone re-forms and – providing that there is sufficient accretion inflow – the cycle repeats.
We first run a test simulation with a disk profile representative of the conditions during an accretion outburst (for Ṁinfall ~ 2 × 10⁻⁵ M⊙ yr-1, see Fig. 1). We begin with an enrichment factor of f0 = 35 (representing the very high D/H enrichment that can be found in LL3 or certain ISM environments). The viscosity parameter is α = 10-2 everywhere. Furthermore, this leads to the fast transport of material. Thus, there is very fast D/H ratio evolution as shown in Fig. 4, where cometary values are reached in the inner 10 AU over the timescale of an outburst. The outburst period lasts a few hundred to a few thousand years and during this time the D/H enrichment decreases to cometary or lower values in the inner disk, but remains high in the outer disk. These outbursts can happen multiple times during the disk phase and they alter the D/H ratio inhomogeneities that may have existed prior to the instability. For any process to have measurable effects on the D/H ratio today it has to happen after the last accretion outburst, when the disk infall rate from the cloud has dropped to values below certain threshold point. Thus, in the next section and for our standard model we consider the evolution at lower infall accretion rates.
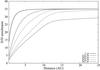 |
Fig. 4 Evolution of D/H ratio during an accretion outburst. This simulation starts with f = 35 as the initial condition to reflect the very high enrichment values often found in LL3 and certain ISM regions. |
3.1. Standard model
We now describe our standard model with an infall accretion rate of Ṁinfall = 10-6 M⊙ yr-1. We consider a time between outbursts as shown in Fig. 2. We assume that the last accretion outburst happened at an infall accretion rate of around Ṁinfall ~ 1 × 10⁻⁶ M⊙ yr-1. Thus, the disk structure does not change rapidly after this. The dead zone accumulates material and heats up in the outer parts by self-gravity leading to the thermal gradient reversal, but without reaching a sufficiently high temperature (~800 K) to trigger a further outburst. Results for this model are shown in Fig. 5. We note that the D/H ratio decreases in mainly two locations: in the inner hot disk, and around the thermal peak centered at 3.5 AU. The width and limits of the D/H ratio dip around this region are controlled by the turbulence strength. We also note that in the inner disk, equilibrium is reached in less than 104 yr, faster than the evolution time of the disk, thus justifying the use of a snapshot disk model in this region. We discuss this further in Sect. 3.5. Finally, it should be noted that Fig. 5 shows f decreasing to values lower than the average cometary D/H in the outer disk at late times, but this is an artifact of our disk cooling handling as discussed in the next section.
3.2. Disk cooling and photoevaporation
As long as there is a hot region (T higher than ~400 K) along with turbulence within the disk, the global D/H ratio will continue to evolve until it reaches A(T) (f ~ 1) throughout the disk (all water equilibrated to nebular gas D/H ratio). Such values of f for the entire disk are contradictory to observations. There are two possible explanations for this.
First, the disk could have cooled down sufficiently quickly for the D/H ratio profile to become frozen, as considered in the classical models (Mousis et al. 2000; Hersant et al. 2001). For low enough temperatures, the chemical exchange (through k(T)) becomes very slow and inefficient. The gas-gas reaction then stops completely once water condenses into ice. This needs to happen before the value of f in the chondrite region becomes too low. This is equivalent to the water snow line radius moving quickly inside the chondrite formation region. The snow line is the radial location in the disk inside of which water is gaseous, and outside of which solid, that occurs at a temperature of around Tsnow = 170 K (Lecar 2006). For our standard model with an accretion rate of Ṁinfall = 1 × 10⁻⁶ M⊙ yr-1, the snow line is at a radius of around 9 AU. The disk will remain in this state while Ṁinfall decreases over time and the snow line moves slowly inward (Martin & Livio 2012; and see Eq. (19) in Martin & Livio 2013). For the disk parameters we have chosen, our model shows that when Ṁinfall reaches ~10-8 M⊙ yr-1, the disk will quickly become cool with a classical monotonic thermal profile with a snow line radius of around 1 AU (see Fig. 2, bottom panel). The infall accretion rate is given by  (8)(Eq. (19) in Martin et al. 2012b), where Ṁi is the initial infall accretion rate (in this case we take Ṁi = 10-6 M⊙ yr-1), t is time, tff is the free-fall timescale (we take tff = 105 yr, e.g., Armitage et al. 2001). This equation shows that Ṁinfall will reach ~10-8 M⊙ yr-1 in about 5 × 10⁵ yr. We therefore stop our simulations at this time, and use the end state results to fit the measurements. We are therefore implicitly assuming that the transition to a cold classical MRI active disk happens quickly, with the snowline moving in from the giant planet region to around 1 AU, thus freezing the D/H ratio in the chondrite regions. The final D/H profile in Fig. 5 is thus in the solid phase.
The second explanation for how the D/H radio profile became frozen is that the disk was completely photoevaporated on a similar timescale to the evolution of f. During the photoevaporation process at the end of the disk lifetime, the disk is dispersed on a short timescale of around 105 yr (Clarke et al. 2001; Alexander et al. 2006; Owen et al. 2010). Thus, the profile for the ratio of D/H would become fixed in the chrondrites at this time and similarly, the shape of the profile shown in Fig. 2 would become fixed at this time.
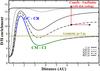 |
Fig. 5 Evolution of D/H ratio enrichment for our nominal disk. These profiles allow an important D/H ratio diversity in the chondrite formation region. They explain the values measured in the different chondrite families from their formation location. These inferred formation locations are also compatible with the water abundances of chondrites, with OCs and CRs containing less water (hence probably forming closer to the Sun) than CMs and CIs. The exact distance relative to the Sun is not important since the model is scalable with Ṁinfall. The D/H ratios in comets, Enceladus, and VSMOW (Earth) are shown for reference. Having f decreasing to low values in the cometary region at late times is an artifact of our disk cooling treatment and should be higher with a consistent treatment. Indeed, when the temperature drops below the water condensation point, we keep evolving f, letting it continue to drop, while it should be fixed at the value reached when the water became isolated from gas by freezing. |
3.3. Implications for chondrites
Now we discuss the implications of our model for chondrites. Figure 5 shows our nominal D/H profile obtained for our nominal model, with some known chondritic D/H ratio ranges. The profile shows a clear peak reaching f ~ 15 around 2 AU, followed by a dip reaching f ~ 4 around 3.5 AU. The curve then increases all the way to the cometary values. The absolute peak and dip positions with respect to the Sun in this plot are not very important, since they are sensitive to Ṁinfall, and thus can be varied (since the chondrite parent bodies probably formed slightly outward of these positions, to allow for S-type asteroids to form around 2.2 AU). We chose a single model for simplicity, and this particular value to remain consistent with Martin & Lubow (2013) to allow for comparison. As seen in Fig. 5, this profile can fit the D/H values found in most chondrites, and explain their diversity from their formation location. Thus, this explains why CRs have a higher D/H value than other type of chondrites. The relative formation locations in this plot are also compatible with their water abundances (Wood 2005; Brearley 2006), although this abundance alone has its limitations due to the very nature of chondrites as an association of different components. Other indicators such as chondrule abundance should be taken into account. The CI and CM chondrites are more aqueously altered than CRs and OCs, which are more reduced. Assuming naively that water abundance increases with heliocentric distance (although see the dynamical water distribution models of e.g., Ciesla & Cuzzi 2006; Ali-Dib et al. 2014), this implies that CIs and CMs formed farther out than CRs and OCs, which is compatible with this profile, and was proposed by Wood (2005). We can also tentatively try to fit the remaining chondrite families (COs and CVs) that are more reduced than CMs but less than OCs. The D/H profile does contain regions that fit their values; however, we note that there are many uncertainties present in the model since it is only a proof of concept. A caveat in this model is that CIs form too close to CMs, although a distance of several AU might be needed between the formation locations of the two to allow the formation of chondrules.
3.4. Implications for comets
The next step is to check if such model can explain the D/H ratio diversity in comets. Naively one can expect that earlier in the disk lifetime, when Ṁinfall was higher, the thermal peak could have existed farther out in the disk, maybe in the comet region. This can lead to a D/H profile analogous to Fig. 5, but farther out in disk, with its own peak and dip. This dip can give a neat explanation for the relatively low D/H value in 103P/Hartley, with the other comets forming in other locations. Assuming a classical comet formation model with the JFCs forming farther out than OCCs, 103P/Hartley could have formed on the D/H dip, while 67P/C-G formed slightly farther out, outside of the dip, and the OCCs inside of it. To test this hypothesis we used a profile derived from our disk simulation with Ṁinfall = 2 × 10⁻⁵ M⊙ yr-1 corresponding to the time just before an outburst. The results are shown in Fig. 2 (top panel). At this stage of the disk evolution, the thermal reversal (and the corresponding D/H enrichment dip) are around 8 AU, farther out than in our canonical case, and as expected from an early disk. The thermal reversal’s position, even for such a young disk, is still too close in to be relevant for comet formation. Another problem posed by this profile is that it almost certainly leads to an outburst, homogenizing the D/H ratio across the disk. Within the model and parameters that we use, we are unable to explain the low D/H ratio in 67P/C-G. The possibility that there is another set of parameters and/or assumptions within the same framework that can lead to a thermal reversal in the comet region is not excluded, however, and is left to future work. We note that all cometary D/H models assume that the value measured in the comet’s ejecta reflect its bulk value, although Podolak et al. (2002) showed that the nuclei D/H ratio might be different than on the surface. Additionally, experiments by Brown et al. (2012) showed that the measured value might also change a function of the instrument-target distance.
Another seemingly unrelated problem that can be addressed using such models is the origin of crystal silicates and Calcium-Aluminum inclusions (CAIs) in comets. These minerals can form only at temperatures on the order of thousands of kelvins, but they are found in comets (Campins & Ryan 1989; Wooden et al. 2005; Chi et al. 2009; Kelley & Wooden 2009). How the high temperature minerals got to the cold region where comets form is a classic problem. Some of the proposed solutions are outward turbulent diffusion of particles (Bockelée-Morvan et al. 2002) and photophoresis (Mousis et al. 2007). The recent observation of narrow crystal silicates features in the spectra of a young solar-like star during an accretion outburst indicated that these outbursts might be the formation mechanism of high temperature minerals (Ábrahám et al. 2009). For the accretion outburst for Ṁinfall ~ 2 × 10⁻⁵ M⊙ yr-1, the outburst trigger radius (the radius of the temperature peak) in our model is around 7 AU (see Fig. 1), considerably widening the high temperature mineral formation region. It should be mentioned that most materials inside the trigger radius get accreted onto the Sun during the accretion outburst, so only elements forming beyond this radius remain in the disk. Quantifying any of these possible solutions is beyond the scope of this work.
3.5. Caveats
Since this work was only intended to be a proof of principle highlighting the concept and quantifying the relative strengths of diffusion and chemistry in a non-monotonic nebula, numerous assumptions and simplifications were made in this model:
-
Ideally, one should use a time evolving disk model coupled dynamically with the D/H module, to track the simultaneous evolution of both components. However, for simplicity we used a static (snapshot) disk profile with the time dependent D/H module. Hence, we are making the implicit assumption that the D/H ratio evolves on a shorter timescale than the disk. This assumption is justified by the short timescale of the D/H evolution (104−105 yr) compared to the disk evolution timescale (~106 yr).
-
Our disk profiles are derived from a layered (active and dead zones) disk. In this work, we only track the D/H ratio in the midplane (dead zone) and ignore any effect the active layer might have, including the sedimentation of equilibrated water. Our work is thus valid only if the dead zone surface density is much higher than the active layer surface density. Since our domain starts beyond the dead zone inner boundary at 0.5 AU and extends out to the snow line radius at 9 AU (for the particular choice of the infall rate and thus disk age), much closer than the dead zone outer boundary at 23 AU. This validity condition for our model is thus applicable throughout the entire domain.
-
We note that there are several unknown parameters in the layered disc model. For example, the critical surface density that is ionized by external sources is not well determined. Dead zone models that include more physics generally find active layer surface densities that may be very small (e.g., Bai 2011). However, such small active layers cannot explain accretion rates observed in T Tauri stars (e.g., Perez-Becker & Chiang 2011; Martin et al. 2012b). Thus we fold all of the uncertainty into the parameter Σcrit. The value of α in the active layers is also not well determined. However, these parameters do not affect the qualitative behavior of the disc.
-
In this work we started our main simulation (Fig. 5) from a constant D/H value throughout the disk. Realistically, however, the preceding outburst may lead to a heterogeneous D/H distribution. Quantifying this effect needs a fully time dependent coupled disk-D/H evolution, for a smooth temperature variation to occur. This is left for future work.
-
Recently, 2D (r − z) steady-state models of protoplanetary discs have been constructed with an α-variation over the disc height to mimic the effects of a reduced (but non-zero) α in a dead zone (Bitsch et al. 2014). These disc models do not find the increase in temperature in the dead zone region present in our disc models because self-gravity does not operate. There is not a sufficient buildup of material in their disc models to cause the disc to become self-gravitating because the chosen values for α are high enough for a steady state disc to be found. Martin & Lubow (2014) showed that even with some turbulence in the dead zone, the qualitative disc behavior is as we have described in this paper, unless the turbulence in the dead zone is comparable to that in the active layer where a steady state may be found. Previous 2D (r − z) simulations that are time-dependent and included a dead zone with a smaller viscosity agree with the numerical models used in this work (Zhu et al. 2009). Additional detailed magnetohydrodynamic time-dependent numerical simulations are required in order to determine the correct value of α in the dead zone (see, e.g., Simon et al. 2013).
-
In our simplified model, we set the viscosity in the dead zone to zero, except where it is generated by self-gravity. It is possible for other hydrodynamical instabilities to operate in the dead zone (for example the baroclinic instability and vertical shear instability Turner et al. 2014). However, as discussed by Martin & Lubow (2014), the qualitative disc behavior is the same even if there is a small amount of turbulence in the dead zone. The temperature peak is still there, and the outbursts still occur.
4. Conclusions
We have coupled a D/H enrichment code including diffusion, advection, and chemical exchange to snapshots from a protoplanetary disk model that includes a dead zone. The disk model contains a local temperature peak at a radius of around 3 AU due to the heating by self-gravity in the outer parts of the dead zone. We found that this leads to a dip in the D/H profile around the same region, in contrast with the classical monotonic D/H models. The new profile can explain the origin of the D/H ratio variations between the different chondrite families. We propose that CI chondrites (which have a relatively low D/H ratio) formed in the region of the thermal gradient reversal, but CRs (which have a high D/H ratio) formed just inside this region. The new D/H profile also accommodates the formation of COs, CVs, and CMs. However, even with a younger disk profile the model is unable to explain the D/H ratio in 67P/C-G. The thermal gradient reversal is too close to the Sun to be relevant. Finally, we proposed that the accretion outbursts associated with these models can explain the presence of high temperature minerals across the disk.
This work shows that detailed temperature profiles from time-dependent layered disk models provide a potential explanation for the rich variation of D/H ratios found in the solar system. A more detailed understanding of the role the thermal inversions in dead zones and outbursts plays in shaping the chemistry of the nebula necessitate a more elaborate exploration of the parameter space, and should be the subject of future works.
Acknowledgments
Special thanks go to D. Bockelée-Morvan and E. Lellouch for useful discussions on comets. We thank the two anonymous referees for useful comments. M.A.-D was supported by a grant from the city of Besançon. O.M. acknowledges support from CNES. This work has been partly carried out thanks to the support of the A*MIDEX project (No. ANR-11-IDEX-0001-02) funded by the “Investissements d’Avenir” French Government program, managed by the French National Research Agency (ANR). J.I.L. acknowledges support from the JWST program through a grant from NASA Goddard.
References
- Ábrahám, P., Juhász, A., Dullemond, C. P., et al. 2009, Nature, 459, 224 [NASA ADS] [CrossRef] [PubMed] [Google Scholar]
- Alexander, R. D., Clarke, C. J., & Pringle, J. E. 2006, MNRAS, 369, 229 [NASA ADS] [CrossRef] [Google Scholar]
- Alexander, C. M. O. ’D., Newsome, S. D., Fogel, M. L., et al. 2010, Geochim. Cosmochim. Acta, 74, 4417 [NASA ADS] [CrossRef] [Google Scholar]
- Alexander, C. M. O. D’., Bowden, R., Fogel, M. L., et al. 2012, Science, 337, 721 [NASA ADS] [CrossRef] [PubMed] [Google Scholar]
- Ali-Dib, M., Mousis, O., Petit, J.-M., & Lunine, J. I. 2014, ApJ, 785, 125 [NASA ADS] [CrossRef] [Google Scholar]
- Altwegg, K., Balsiger, H., Bar-Nun, A., et al. 2015, Science, 347, 1261952 [Google Scholar]
- Armitage, P. J., Livio, M., & Pringle, J. E. 2001, MNRAS, 324, 705 [NASA ADS] [CrossRef] [Google Scholar]
- Bai, X.-N. 2011, ApJ, 739, 50 [NASA ADS] [CrossRef] [Google Scholar]
- Baillié, K., Charnoz, S., & Pantin, E. 2015, A&A, 577, A65 [NASA ADS] [CrossRef] [EDP Sciences] [Google Scholar]
- Balbus, S. A., & Hawley, J. F. 1991, ApJ, 376, 214 [NASA ADS] [CrossRef] [Google Scholar]
- Basu, S. 1998, ApJ, 509, 229 [NASA ADS] [CrossRef] [Google Scholar]
- Bate, M. R. 2011, MNRAS, 417, 2036 [NASA ADS] [CrossRef] [Google Scholar]
- Bockelée-Morvan, D., Gautier, D., Hersant, F., Huré, J.-M., & Robert, F. 2002, A&A, 384, 1107 [NASA ADS] [CrossRef] [EDP Sciences] [Google Scholar]
- Bitsch, B., Morbidelli, A., Lega, E., Kretke, K., & Crida, A. 2014, A&A, 570, A75 [NASA ADS] [CrossRef] [EDP Sciences] [Google Scholar]
- Brasser, R., & Morbidelli, A. 2013, Icarus, 225, 40 [NASA ADS] [CrossRef] [Google Scholar]
- Brearley, A. J. 2006, Meteorites and the Early Solar System II, 584 [Google Scholar]
- Brown, P. D., & Millar, T. J. 1989, MNRAS, 237, 661 [NASA ADS] [Google Scholar]
- Brown, R. H., Lauretta, D. S., Schmidt, B., & Moores, J. 2012, Planet. Space Sci., 60, 166 [NASA ADS] [CrossRef] [Google Scholar]
- Campins, H., & Ryan, E. V. 1989, ApJ, 341, 1059 [NASA ADS] [CrossRef] [Google Scholar]
- Cannizzo, J. K. 1993, ApJ, 419, 318 [NASA ADS] [CrossRef] [Google Scholar]
- Ceccarelli, C., Caselli, P., Bockelée-Morvan, D., et al. 2014, Protostars and Planets VI, 859 [Google Scholar]
- Chapman, C. R. 1996, Meteoritics, 31, 699 [Google Scholar]
- Chi, M., Ishii, H. A., Simon, S. B., et al. 2009, Geochim. Cosmochim. Acta, 73, 7150 [NASA ADS] [CrossRef] [Google Scholar]
- Ciesla, F. J., & Cuzzi, J. N. 2006, Icarus, 181, 178 [NASA ADS] [CrossRef] [Google Scholar]
- Clarke, C. J., Gendrin, A., & Sotomayor, M. 2001, MNRAS, 328, 485 [NASA ADS] [CrossRef] [Google Scholar]
- Cleeves, L. I., Bergin, E. A., Qi, C., Adams, F. C., Öberg, K. I. 2015, ApJ, 799, 204 [NASA ADS] [CrossRef] [Google Scholar]
- Dartois, E., Thi, W.-F., Geballe, T. R., et al. 2003, A&A, 399, 1009 [NASA ADS] [CrossRef] [EDP Sciences] [Google Scholar]
- Drouart, A., Dubrulle, B., Gautier, D., & Robert, F. 1999, Icarus, 140, 129 [NASA ADS] [CrossRef] [Google Scholar]
- Dubrulle, B., & Frisch, U. 1991, Phys. Rev. A, 43, 5355 [NASA ADS] [CrossRef] [MathSciNet] [PubMed] [Google Scholar]
- Dzyurkevich, N., Turner, N. J., Henning, T., & Kley, W. 2013, ApJ, 765, 114 [NASA ADS] [CrossRef] [Google Scholar]
- Fleming, T., & Stone, J. M. 2003, ApJ, 585, 908 [NASA ADS] [CrossRef] [Google Scholar]
- Fromang, S., Terquem, C., & Balbus, S. A. 2002, MNRAS, 329, 18 [NASA ADS] [CrossRef] [Google Scholar]
- Gammie, C. F. 1996, ApJ, 457, 355 [NASA ADS] [CrossRef] [Google Scholar]
- Glassgold, A. E., Najita, J., & Igea, J. 2004, ApJ, 615, 972 [NASA ADS] [CrossRef] [Google Scholar]
- Gressel, O., Nelson, R. P., & Turner, N. J. 2012, MNRAS, 422, 1140 [NASA ADS] [CrossRef] [Google Scholar]
- Gressel, O., Turner, N. J., Nelson, R. P., & McNally, C. P. 2015, ApJ, 801, 84 [NASA ADS] [CrossRef] [Google Scholar]
- Hartmann, L., Calvet, N., Gullbring, E., & D’Alessio, P. 1998, ApJ, 495, 385 [NASA ADS] [CrossRef] [Google Scholar]
- Hartogh, P., Lis, D. C., Bockelée-Morvan, D., et al. 2011, Nature, 478, 218 [NASA ADS] [CrossRef] [PubMed] [Google Scholar]
- Hersant, F., Gautier, D., & Huré, J.-M. 2001, ApJ, 554, 391 [NASA ADS] [CrossRef] [Google Scholar]
- Jacquet, E., & Robert, F. 2013, Icarus, 223, 722 [NASA ADS] [CrossRef] [Google Scholar]
- Kavelaars, J. J., Mousis, O., Petit, J.-M., & Weaver, H. A. 2011, ApJ, 734, L30 [NASA ADS] [CrossRef] [Google Scholar]
- Kelley, M. S., & Wooden, D. H. 2009, Planet. Space Sci., 57, 1133 [NASA ADS] [CrossRef] [Google Scholar]
- Klahr, H. H., & Bodenheimer, P. 2003, ApJ, 582, 869 [NASA ADS] [CrossRef] [Google Scholar]
- Kratter, K. M., Matzner, C. D., & Krumholz, M. R. 2008, ApJ, 681, 375 [NASA ADS] [CrossRef] [Google Scholar]
- Lecar, M., Podolak, M., Sasselov, D., & Chiang, E. 2006, ApJ, 640, 1115 [Google Scholar]
- Lécluse, C., & Robert, F. 1994, Geochim. Cosmochim. Acta, 58, 2927 [NASA ADS] [CrossRef] [Google Scholar]
- Lellouch, E., Bézard, B., Fouchet, T., et al. 2001, A&A, 370, 610 [NASA ADS] [CrossRef] [EDP Sciences] [Google Scholar]
- Lesur, G., & Ogilvie, G. I. 2010, MNRAS, 404, L64 [NASA ADS] [Google Scholar]
- Lodato, G., & Rice, W. K. M. 2004, MNRAS, 351, 630 [Google Scholar]
- Lynden-Bell, D., & Pringle, J. E. 1974, MNRAS, 168, 603 [NASA ADS] [CrossRef] [Google Scholar]
- Martin, R. G., & Livio, M. 2012, MNRAS, 425, L6 [NASA ADS] [CrossRef] [Google Scholar]
- Martin, R. G., & Livio, M. 2013, MNRAS, 434, 633 [NASA ADS] [CrossRef] [Google Scholar]
- Martin, R. G., & Lubow, S. H. 2011, ApJ, 740, L6 [Google Scholar]
- Martin, R. G., & Lubow, S. H. 2013, MNRAS, 432, 1616 [NASA ADS] [CrossRef] [Google Scholar]
- Martin, R. G., & Lubow, S. H. 2014, MNRAS, 437, 682 [NASA ADS] [CrossRef] [Google Scholar]
- Martin, R. G., Lubow, S. H., Livio, M., & Pringle, J. E. 2012a, MNRAS, 420, 3139 [NASA ADS] [CrossRef] [Google Scholar]
- Martin, R. G., Lubow, S. H., Livio, M., & Pringle, J. E. 2012b, MNRAS, 423, 2718 [NASA ADS] [CrossRef] [Google Scholar]
- Morbidelli, A. 2008, Saas-Fee Advanced Course 35: Trans-Neptunian Objects and Comets, 79 [Google Scholar]
- Mousis, O., Gautier, D., Bockelée-Morvan, D., et al. 2000, Icarus, 148, 513 [NASA ADS] [CrossRef] [Google Scholar]
- Mousis, O., Petit, J.-M., Wurm, G., et al. 2007, A&A, 466, L9 [NASA ADS] [CrossRef] [EDP Sciences] [Google Scholar]
- Mothé-Diniz, T., Carvano, J. M., & Lazzaro, D. 2003, Icarus, 162, 10 [NASA ADS] [CrossRef] [Google Scholar]
- Mumma, M. J., & Charnley, S. B. 2011, ARA&A, 49, 471 [NASA ADS] [CrossRef] [Google Scholar]
- Owen, J. E., & Jacquet, E. 2015, MNRAS, 446, 3285 [NASA ADS] [CrossRef] [Google Scholar]
- Owen, J. E., Ercolano, B., Clarke, C. J., & Alexander, R. D. 2010, MNRAS, 401, 1415 [NASA ADS] [CrossRef] [Google Scholar]
- Paczynski, B. 1978, Acta Astron., 28, 91 [Google Scholar]
- Parise, B., Du, F., Liu, F.-C., et al. 2012, A&A, 542, L5 [NASA ADS] [CrossRef] [EDP Sciences] [Google Scholar]
- Perez-Becker, D., & Chiang, E. 2011, ApJ, 727, 2 [NASA ADS] [CrossRef] [Google Scholar]
- Petersen, M. R., Julien, K., & Stewart, G. R. 2007, ApJ, 658, 1236 [NASA ADS] [CrossRef] [Google Scholar]
- Piani, L., Robert, F., & Remusat, L. 2015, Earth Planet. Sci. Lett., 415, 154 [NASA ADS] [CrossRef] [Google Scholar]
- Podolak, M., Mekler, Y., & Prialnik, D. 2002, Icarus, 160, 208 [NASA ADS] [CrossRef] [Google Scholar]
- Pringle, J. E. 1981, ARA&A, 19, 137 [NASA ADS] [CrossRef] [Google Scholar]
- Pringle, J. E., Verbunt, F., & Wade, R. A. 1986, MNRAS, 221, 169 [NASA ADS] [Google Scholar]
- Prinn, R. G. 1990, ApJ, 348, 725 [NASA ADS] [CrossRef] [Google Scholar]
- Robert, F. 2006, Meteorites and the Early Solar System II, 341 [Google Scholar]
- Robert, F., & Epstein, S. 1982, Geochim. Cosmochim. Acta, 46, 81 [CrossRef] [Google Scholar]
- Shakura, N. I., & Sunyaev, R. A. 1973, A&A, 24, 337 [NASA ADS] [Google Scholar]
- Shu, F. H. 1977, ApJ, 214, 488 [NASA ADS] [CrossRef] [Google Scholar]
- Simon, J. B., Armitage, P. J., & Beckwith, K. 2011, ApJ, 743, 17 [NASA ADS] [CrossRef] [Google Scholar]
- Simon, J. B., Bai, X.-N., Stone, J. M., Armitage, P. J., & Beckwith, K. 2013, ApJ, 764, 66 [NASA ADS] [CrossRef] [Google Scholar]
- Spencer, J. R., Barr, A. C., Esposito, L. W., et al. 2009, in Saturn from Cassini-Huygens (Springer), 683 [Google Scholar]
- Toomre, A. 1964, ApJ, 139, 1217 [NASA ADS] [CrossRef] [Google Scholar]
- Turner, N. J., Fromang, S., Gammie, C., et al. 2014, Protostars and Planets VI, eds. H. Beuther, R. S. Klessen, C. P. Dullemond, & Th. Henning (Tucson: University of Arizona Press), 411 [Google Scholar]
- Umebayashi, T. 1983, Progr. Theor. Phys., 69, 480 [NASA ADS] [CrossRef] [Google Scholar]
- Walsh, K. J., Morbidelli, A., Raymond, S. N., O’Brien, D. P., & Mandell, A. M. 2011, Nature, 475, 206 [NASA ADS] [CrossRef] [PubMed] [Google Scholar]
- Waite, J. H., Jr., Lewis, W. S., Magee, B. A., et al. 2009, Nature, 460, 487 [NASA ADS] [CrossRef] [Google Scholar]
- Wood, J. A. 2005, Chondrites and the Protoplanetary Disk, 341, 953 [NASA ADS] [Google Scholar]
- Wooden, D. H., Harker, D. E., & Brearley, A. J. 2005, Chondrites and the Protoplanetary Disk, 341, 774 [Google Scholar]
- Yang, L., Ciesla, F. J., & Alexander, C. M. O.’D. 2013, Icarus, 226, 256 [NASA ADS] [CrossRef] [Google Scholar]
- Zhu, Z., Hartmann, L., & Gammie, C. 2009, ApJ, 694, 1045 [NASA ADS] [CrossRef] [Google Scholar]
- Zhu, Z., Hartmann, L., Gammie, C. F., et al. 2010, ApJ, 713, 1134 [NASA ADS] [CrossRef] [Google Scholar]
All Tables
Measured water D/H fractionation and abundance in small bodies in the solar system.
All Figures
|
Fig. 1 Disk surface density (left panel) and temperature (right panel) structure for the high infall accretion rate Ṁinfall = 2 × 10⁻⁵ M⊙ yr-1. The profiles are shown just before, during, and just after an accretion outburst. The “during outburst” profile is used in the calculations corresponding to Fig. 4. |
| In the text | |
|
Fig. 2 Disk surface density (left panel) and temperature (right panel) for Ṁinfall = 2 × 10⁻⁵ M⊙ yr-1 (at a time just before an outburst), 10-6 M⊙ yr-1 (at a time between outbursts), and Ṁinfall = 10-8M⊙ yr-1 (in steady state). The thermal gradient reversal observable in the right panel is the main element of the disk model. We use Ṁinfall = 1 × 10⁻⁶ M⊙ yr-1 as our nominal disk model. |
| In the text | |
|
Fig. 3 Dead zone midplane turbulent viscosity parameter αd. If the disc is not self-graviting (i.e., Q>Qcrit), then αd = 0. Otherwise, its value is depicted by Eq. (7). We note that we manually smooth the viscosity variation (hence αd) over five grid points to avoid code divergence. For Ṁinfall = 10-6 M⊙ yr-1 the smoothing is between 2.2 and 2.5 AU and for Ṁinfall = 2 × 10⁻⁵ M⊙ yr-1 between 5.2 and 5.5 AU. |
| In the text | |
|
Fig. 4 Evolution of D/H ratio during an accretion outburst. This simulation starts with f = 35 as the initial condition to reflect the very high enrichment values often found in LL3 and certain ISM regions. |
| In the text | |
|
Fig. 5 Evolution of D/H ratio enrichment for our nominal disk. These profiles allow an important D/H ratio diversity in the chondrite formation region. They explain the values measured in the different chondrite families from their formation location. These inferred formation locations are also compatible with the water abundances of chondrites, with OCs and CRs containing less water (hence probably forming closer to the Sun) than CMs and CIs. The exact distance relative to the Sun is not important since the model is scalable with Ṁinfall. The D/H ratios in comets, Enceladus, and VSMOW (Earth) are shown for reference. Having f decreasing to low values in the cometary region at late times is an artifact of our disk cooling treatment and should be higher with a consistent treatment. Indeed, when the temperature drops below the water condensation point, we keep evolving f, letting it continue to drop, while it should be fixed at the value reached when the water became isolated from gas by freezing. |
| In the text | |
Current usage metrics show cumulative count of Article Views (full-text article views including HTML views, PDF and ePub downloads, according to the available data) and Abstracts Views on Vision4Press platform.
Data correspond to usage on the plateform after 2015. The current usage metrics is available 48-96 hours after online publication and is updated daily on week days.
Initial download of the metrics may take a while.