| Issue |
A&A
Volume 582, October 2015
|
|
|---|---|---|
| Article Number | A42 | |
| Number of page(s) | 11 | |
| Section | Stellar structure and evolution | |
| DOI | https://doi.org/10.1051/0004-6361/201526739 | |
| Published online | 05 October 2015 | |
Accurate fundamental parameters and distance to a massive early-type eclipsing binary in the Danks 2 cluster⋆
1 IAASARS, National Observatory of Athens, 15236 Penteli, Greece
e-mail: mkourniotis@astro.noa.gr
2 Section of Astrophysics, Astronomy and Mechanics, Faculty of Physics, University of Athens, Panepistimiopolis, 15784 Zografos, Athens, Greece
3 Argelander-Institut für Astronomie der Universität Bonn, Auf dem Hügel 71, 53121 Bonn, Germany
4 SRON Netherlands Institute for Space Research, Landleven 12, 9747 AD Groningen, The Netherlands
5 Kapteyn Institute, University of Groningen, 9712 Groningen, The Netherlands
6 Núcleo de Astronomía de la Facultad de Ingeniería, Universidad Diego Portales, Av. Ejército 441, Santiago, Chile
7 Millennium Institute of Astrophysics, Santiago, Chile
Received: 14 June 2015
Accepted: 5 August 2015
We present a study of the properties of the O-type, massive eclipsing binary 2MASS J13130841-6239275 located in the outskirts of the Danks 2 cluster in the G305 star-forming complex, using near-infrared spectroscopy from VLT/ISAAC. We derive the masses and radii to be 24.5 ± 0.9 M⊙ and 9.2 ± 0.1 R⊙ for the primary and 21.7 ± 0.8 M⊙ and 8.7 ± 0.1 R⊙ for the secondary component. In addition, we evaluate the sensitivity of our parameters to the choice of the spectral features used to determine the radial velocities. Both components appear to be main-sequence O6.5−O7 type stars at an age of ~5 Myr, which is in agreement with the age of the cluster. A high visual extinction of A5495 = 11.9 ± 0.1 mag is reported, which is likely attributed to the cold molecular gas contaminating the northeast region of the cluster. By fitting the spectral energy distribution of the system to the available BVIcJHKs photometry, we determine a distance to the system of 3.52 ± 0.08 kpc with a precision of 2%, which is the most well-determined distance to the Danks 2 cluster and the host complex reported in the literature.
Key words: binaries: eclipsing / open clusters and associations: individual: Danks / stars: distances / stars: early-type / stars: massive
© ESO, 2015
1. Introduction
The G305.4+0.1 complex (hereafter, G305) is one of the most massive, ongoing star-forming regions in the Galaxy (Clark & Porter 2004). It is home to nine H ii regions (Caswell & Haynes 1987), which are powered by the ionizing flux of hot stars; these regions are spatially associated with maser emission and at least five star clusters (Dutra et al. 2003) embedded in the complex. Whereas the majority of these clusters are compact and thus unresolved, the Danks 1 and 2 clusters (Danks et al. 1983, 1984), which reside in the center of the complex, are resolved and thus allow for studies of their physical properties. Both clusters have been shown to be ≤7 Myr old, with Danks 2 being noticeably older than Danks 1 (Chené et al. 2012). In addition, initial masses of 8000 and 3000 M⊙ were derived for Danks 1 and 2 respectively, with an uncertainty that reaches ~30% (Davies et al. 2012). Constraining the properties of the clusters relies on an accurate determination of the distance, extinction and their associated uncertainties. To date, the most robust method to provide accurate distance measurements to young galactic clusters and nearby galaxies is with the use of eclipsing binaries (EBs; e.g. Pietrzyński et al. 2013).
Eclipsing binaries exhibiting double-lined spectra provide a geometrical method to precisely measure the fundamental parameters of their components (Andersen 1991; Torres et al. 2010). In particular, the light curve provides the orbital period, eccentricity, the flux ratio of the two stars, fractional radii and the inclination of the system with respect to the observer. From the double-lined spectra, we measure the velocities of the individual components. The fit to these velocities yields the velocity semi-amplitudes, and therefore, the ratio of the masses. Effective temperatures and thus luminosities can be estimated by fitting synthetic spectra to the observed ones. Therefore, an accurate determination of the reddening law and thereby distance, is feasible (e.g. Bonanos et al. 2006, 2011). Selecting systems that host well-separated components (i.e. detached systems), avoids complexities that originate from a common-envelope state. Such systems are of major importance for testing theoretical stellar evolutionary models of single stars. Light curves of detached systems that display eclipses of similar depth ensure roughly equal contribution of both components to the total flux and such systems with orbital periods ≤10 days are likely to provide double-lined and well-separated spectra.
Summary of the parameters of the Danks 2 cluster and D2–EB.
It is claimed that the majority of hot, massive stars are in close binary systems (Chini et al. 2012; Sana et al. 2012; Sota et al. 2014), thus increasing the possibility of observing short-period, eclipsing configurations (e.g. Kourniotis et al. 2014). Such systems constitute extragalactic anchors, ideal for the calibration of the cosmic distance scale (e.g. Guinan et al. 1998; Hilditch et al. 2005; Ribas et al. 2005; Bonanos et al. 2006, 2011) and, when found in young Galactic clusters, can also set tight constraints on the age, chemical composition, and distance (e.g. Southworth & Clausen 2006; Koumpia & Bonanos 2012). In this work, we investigate the properties of 2MASS J13130841-6239275 (hereafter D2–EB), a massive EB located ~2′ from the center of the Danks 2 cluster that constitutes a luminous, double-lined spectroscopic system. A summary of the parameters of D2–EB derived in the present work along with the parameters of the Danks 2 cluster, are listed in Table 1.
During the optical variability survey by Bonanos et al. (in prep.), D2–EB1 was discovered to be a well-detached eclipsing system. Owing to the heavy foreground visual extinction in the direction of the clusters (Av = 8 − 9 mag, Bica et al. 2004), we obtained near-infrared K-band spectroscopy to resolve double lines in the system. The paper is organized as follows: in Sect. 2 we describe the follow-up spectroscopy and the data reduction; in Sect. 3 we present the radial velocity analysis; in Sect. 4 we model the binary; in Sect. 5 we derive the distance; in Sect. 6 we discuss our results; and in Sect. 7 we finish with some concluding remarks.
2. Observations and data reduction
Bonanos et al. (in prep.) undertook an optical variability survey of the Danks clusters in search of massive EBs over 25 nights in March, April, and May 2011 with the 1 m Swope telescope at Las Campanas Observatory in Chile. The telescope is equipped with a 2048 × 3150 detector with a pixel scale of 0.435″/pixel and a field of view of 14.8′ × 22.8′. Observations were taken between HJD 2 455 648.5 and 2 455 687.83, in the broadband B,V,R,Ic filters over approximately 50, 500, 950, and 530 epochs, respectively. The data were reduced and calibrated to the standard system, and the image subtraction package ISIS (Alard & Lupton 1998; Alard 2000) was used to extract the Ic-band light curves of all sources. The light curves were searched for periodicity with the Analysis of Variance (AoV) algorithm (Schwarzenberg-Czerny 1989) yielding 21 EBs. Of these, 13 were found to display red colors of R − Ic ≥ 0, likely corresponding to members of the highly extincted clusters. The Ic-band light curve of D2–EB was found to display a strong periodic signal of ~3.37 days and appeared to be an ideal target for follow up spectroscopy: a luminous, well-detached and nearly equal-depth eclipsing system.
2.1. Spectroscopy
We obtained K-band spectroscopy of D2–EB with the Infrared Spectrometer and Array Camera (ISAAC) mounted at the Nasmyth A focus of the 8.2 m UT3 (Melipal) at the VLT facility in Chile. The observations were taken under ESO program ID 090.D-0065(A). The spectrograph is equipped with a 1024 × 1024 Hawaii Rockwell array with a pixel scale of 0.148″/pixel (Moorwood et al. 1998). A slit width 0.3″ was used, resulting in a resolving power of R ~ 7500 as measured from the full width half maximum (~2.88 Å) of an unblended telluric OH emission feature at ~2.125 μm. To derive a precise measurement of the velocity semi-amplitudes, we requested eight visits, four per quadrature. In total, eight observing blocks were executed in service mode, six of which correspond to the first quadrature of the system and two to the second. For each observing block, nodding 60″ along the slit was applied in an AB pattern, resulting in two spectra of total integration time 100 s each.
The spectra were reduced using basic IRAF routines2 and wavelength calibrated using telluric OH sky lines (Rousselot et al. 2000) that span the K-band wavelength range. Subsequently, the extracted pair of spectra of each observing block were normalized and averaged, yielding a signal-to-noise ratio (S/N) ~ 150 as measured in the middle of the wavelength coverage (~2.14 μm). Cosmic rays were rejected using the L.A.Cosmic script (van Dokkum 2001). We employed the newly released molecfit tool (Smette et al. 2015), which generates a synthetic model of atmospheric transmission based on the information provided by the FITS header of the science object, to remove telluric features. Heliocentric corrections were calculated using IRAF’s rvcorr task and applied. Table 2 lists the Heliocentric Julian Dates (HJD) of the observations, exposure times and the values of airmass. Of the eight spectra, we discarded the one obtained on HJD 2 456 378.808 74 from further analysis, as it was taken near an eclipse, at phase ~0.47, and contained only one set of spectral features.
Log of spectroscopic observations of D2–EB with VLT/ ISAAC.
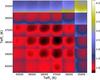 |
Fig. 1 Reduced-χ2 panel of the fit of composite FASTWIND spectra to the ISAAC spectrum of HJD 2 456 345.856 71. Axes denote the effective temperature of the components and are split into six equal intervals with 16 subdivisions of 10 km s-1 each to represent the projected rotational velocity range 50 − 200 km s-1. We find that the best fit corresponds to a pair of templates with Teff1 = 38 kK, Teff2 = 37 kK, and vsini values of 150 ± 20 and 130 ± 20 km s-1, respectively. |
3. Radial velocity analysis
The spectrum of D2–EB clearly displays He ii (2.189 μm) in absorption, which is prominent for both components in phases outside of eclipse. As in the optical, He ii lines appear only in hotter stars and are the main indicator for identifying O-type stars. The observed He i (2.112 μm) in absorption implies that both stars must be later than O5 (Hanson et al. 1996). Both components of D2–EB are hence classified as intermediate/late O-type stars. In addition, our spectra show Brγ (2.166 μm) in absorption, which provides evidence against a supergiant classification. However, a precise luminosity classification strongly depends on the resolution and requires a S/N> 150. Emission of C iv (2.08μm) is evident only for the redshifted component as the blueshifted feature is not within the observed wavelength range. Further analysis of the observed features that are used to measure the radial velocities and to assign a spectral type is presented in Sect. 3.2.
3.1. Analysis using model atmospheres
We used the stellar atmosphere code FASTWIND (Santolaya-Rey et al. 1997; Puls et al. 2005) to synthesize the lines of H and He and measure the radial velocities. The code enables non-LTE calculations and assumes a spherical symmetry geometry. The wind velocity structure is included in the model through a β-like law. We generated a grid of FASTWIND templates at the metallicity of the Galaxy, spanning the temperature range 35–40 kK with a step of 1 kK and fixed the surface gravity at log g = 3.9 dex, as inferred from Sect. 4. The templates were broadened and resampled to match the resolution (R ~ 7500) and dispersion of the observed spectra. To constrain the projected rotational broadening, we implemented a code based on χ2 minimization setting six free parameters, three for each component: temperature, radial velocity and projected rotational velocity. We built synthetic spectra and fit the regions around the Brγ (2.166 μm)/He i (2.162 μm) blend and He ii (2.189 μm) feature of the ISAAC spectrum taken on HJD 2 456 345.856 71 that exhibits well-separated spectral features. Each composite spectrum consists of two FASTWIND templates weighted according to the light ratio provided by the light curve analysis and broadened at the projected rotational velocity range 50–200 km s-1. For the fit, we adopted a σ value of 0.006 7, which corresponds to the standard deviation of the noise in units of normalized flux, based on the mean S/N ~ 150. Figure 1 displays a panel of our analysis providing the reduced-χ2 of the fit with respect to the temperatures and projected rotational velocities of the components. For each set of parameters, radial velocities were measured to optimize the fit. We found that the projected rotational velocities that correspond to the best fit are 150 ± 20 km s-1 and 130 ± 20 km s-1 for the primary and the less luminous secondary component, respectively. These values are in good agreement with those of a tidally locked system whose orbital period is identical to the rotational period for both components (Sect. 4).
To construct the radial velocity curve, we fixed the aforementioned projected rotational velocities and ran the fitting algorithm for the seven ISAAC spectra. Given that the best-fit temperatures are found to range from 36 kK to 38 kK with a 1 kK difference between the temperature of the components, we eventually examined two cases: a set with 37 kK and 38 kK models and a set with 36 kK and 37 kK models. While the former resulted in a best fit for the He ii line, the latter appeared to optimally fit the Brγ/He i feature. We adopted the first case to provide reliable velocity measurements as He ii is a more accurate tracer of the stellar photosphere for stars at these temperatures. Contours of χ2 values for the He ii fit were plotted in two dimensional radial velocity diagrams and the center of the contour corresponding to the lowest χ2 was adopted to generate the best fit. Figure 2 presents the best-fit composite spectra overplotted onto the observed ones, which were smoothed for clarity. The inferred velocities are listed in Table 3. The uncertainties correspond to the standard deviation of the residuals of the observed velocities compared to the best-fit model described in Sect. 4.
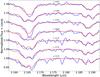 |
Fig. 2 Normalized ISAAC spectra (blue) sorted by the orbital phase (φ) of D2–EB, including the Brγ (2.166 μm)/He i (2.162 μm) blend and the He ii (2.189 μm) line. The composite spectra (red) of two FASTWIND templates of 38 kK and 37 kK, weighted, summed, and shifted to our derived velocities, are overplotted. The best-fit velocites are obtained from the fit of He ii. For clarity, a smoothing window is applied to the observed spectra and a constant is added to the relative fluxes. Absorption features in the wavelength range 2.170 − 2.185μm are due to poor telluric correction. |
Radial velocity measurements of D2–EB using FASTWIND models.
3.2. Analysis using near-infrared atlas
We also explored a different method of analysis by comparing our observations against near-IR spectra of early-type stars of similar resolution and S/N. The work by Hanson et al. (2005) (hereafter H05) provides a near-infrared atlas of Galactic hot stars that comprises 37 well-known, OB-type stars observed with VLT/ISAAC and Subaru/IRCS with a resolution of R ~ 8000 − 12000 and a mean S/N ~ 100 − 300. The spectral types range from O3 to B3 and sample most luminosity classes. The advantage of using the atlas over the FASTWIND templates lies in the availability of extra diagnostic lines such as C iv at 2.08 μm and the blend of the CNO complex at 2.115μm with He i at 2.112μm. As mentioned in H05, the atlas should not be used for an accurate spectral classification, but rather to obtain a first estimate for the temperatures.
Given that the H05 spectra are calibrated to air wavelengths (M. Hanson, priv. comm.), we first applied an air-to-vacuum unit conversion. The resolution of the spectra was reduced to match that of our data and the light ratio was fixed in accordance with the light curve analysis. We found that a composite spectrum of two identical O6.5 III spectra yielded a best fit to our observed spectra. However, there is no O6.5 main-sequence counterpart in the atlas, and so the luminosity class at that temperature is not well determined. The resulting spectral type is in agreement with the effective temperature of 38 kK adopted using FASTWIND models; the recent temperature-spectral type calibration for O-type stars by Simón-Díaz et al. (2014) assigns an effective temperature of 38.7 kK to an O6.5 Milky Way dwarf of surface gravity 3.8 dex, with typical uncertainties of up to 1.5 kK and 0.15 dex, respectively.
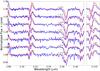 |
Fig. 3 Same as in Fig. 2, but the composite spectrum comprises two O6.5 III spectra taken from Hanson et al. (2005). In the left panel, we show the entire wavelength range of the ISAAC spectra, which includes lines of C iv (2.08 μm), He i (2.113, 2.162 μm), the CNO complex (2.115 μm), Brγ (2.166 μm), and He ii (2.189 μm). The best-fit velocities are measured by fitting all features except for the Brγ/He i blend. In the right panel, we show the result of the separate fit to the CNO/He i blend, which was employed to derive velocities. |
Radial velocity measurements of D2–EB using spectra from H05.
The O6.5 III spectrum from H05 displays helium and hydrogen features in both the H- and K-band. While the centroid of the He i lines appear within 0.5 Å from their theoretical wavelengths (in air, 1.700 25 μm and 2.112 01 μm), the He ii line (2.188 52 μm) clearly displays a ~1.5 Å offset redward. Compared to the adopted FASTWIND template, the blue wing of He ii appears weaker than the red wing. It is unlikely that this is due to inefficient telluric correction, as the H-band He ii feature (1.691 84 μm) also suffers a similar, although smaller (~1 Å) offset. In addition, a phase-dependent velocity discrepancy between the CNO/He i blend and the He ii line is prominent in the ISAAC spectra, as can be seen in Fig. 3. The He ii line is mainly formed in the transition region from the stellar photosphere to the wind (Lenorzer et al. 2004), hence it is dominated by the uncertainty in the wind density structure. We therefore conclude that contamination by stellar winds is the most plausible explanation for this He ii offset (A. Herrero, priv. comm.) as stellar winds are prominent in early-type stars. To avoid a definite bias of this effect to our study, we measured velocities with the H05 spectra in two ways; first, fitting all features except for the Brγ/He i blend and second, fitting only the 2.112 μm He i line along with the CNO complex. While the first method relies on the contribution of four independent features, it is hindered by the uncertainty of the aforementioned He ii effect and of a possible, inefficient correction in our observations for the strong, telluric CO2 absorption band near 2.08 μm, in the region of C iv. Furthermore, both C iv and He ii are found at the edges of the observed regime where the S/N is expected to be lower and in addition, the blueshifted component of C iv is at most phases beyond the edge of our observed spectrum. Our second method employs fewer features; however, they have a better S/N and do not suffer from telluric contamination. The derived velocities following both methods are listed in Table 4 as in Table 3, whereas the best-fit composite spectra are shown in the two panels of Fig. 3. For brevity, the method that excludes the Brγ/He i feature is labeled in the figures and tables as “-Brγ/He i”, whereas the method that employs only the CNO/He i blend feature is labeled as “CNO/He i”.
Results from the analysis of the light and radial velocity curves with PHOEBE.
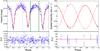 |
Fig. 4 Left panel: Ic-band light curve of D2–EB, phased to the best-fit parameters derived with PHOEBE using spectra from the H05 atlas. Radial velocities were inferred from the fit of the CNO/He i blend. Right panel: radial velocity measurements overplotted by the modeled curve. The solid line denotes the primary component and the dashed line the secondary. Uncertainties correspond to the rms of the best fit, i.e. 11 km s-1 for the primary and 8 km s-1 for the secondary. Green solid lines represent the two observation dates of the BVIc photometry by Baume et al. (2009; six per filter), while the black dashed line indicates the date of the 2MASS measurements. Residuals of the fits are shown in the lower panels. |
4. Binary modeling
We proceeded to a simultaneous fit of both the Ic-band light curve and radial velocity curves with a detached, binary model. We used PHOEBE Subversion (release date 8 July 2012) (Prša & Zwitter 2005), which implements the Wilson-Devinney (WD) code (Wilson & Devinney 1971), to converge into the global optimization using Differential Corrections (DC) powered by a Levenberg-Marquardt fitting scheme. We employed radial velocities measured using FASTWIND templates and the spectra from H05 following both methods discussed in Sect. 3.2.
The primary component is defined to be the star eclipsed at phase zero. The period determined from the AoV analysis of the photometric curve was assigned as an initial guess to the period in PHOEBE. We then fit the light curve with the following free parameters: time of primary eclipse HJD0, period P (days), inclination i (deg), effective temperature of the secondary component Teff2 (K) and surface potentials Ω1,2. We fixed the effective temperature of the primary component at 38 kK. The light curve does not provide evidence for eccentricity, hence we fixed e = 0. Both components were assumed to be tidally sychronized and surface albedos and gravity brightening exponents were fixed to unity, as for stars with radiative envelopes. Limb darkening coefficients were taken from van Hamme (1993) using the square-root law. The well-determined period and HJD0 were fixed to their converged values and we fit the radial velocity curve for the semi-major axis α (R⊙), systemic velocity γ (km s-1) and the ratio q of the mass of the secondary component over that of the primary component. In addition, the Rossiter–McLaughlin effect (Rossiter 1924) was taken into account to correct for velocity shifts near the conjuction that occur when part of the approaching/receding surface of the occulted star is blocked. The root mean square (rms) value of the fit of each velocity curve was assigned to the sigma parameter in PHOEBE to weight the data in the overall cost function of the analysis. As a next step, both light and radial velocity curves were fit simultaneously, setting free all nine mentioned parameters.
To prevent convergence to a local minimum of the solution space, we used the method of parameter-kicking. We first defined convergence as three consecutive iterations where adjusted parameters are less than or equal to their returned uncertainties. When the criterion is satisfied, all parameters are offset by a relative sigma (the “kick”), defined as  (Prša & Zwitter 2005), where Ntot is the total number of points from the fitted photometric and velocity data sets. Of the 1000 sets of parameters, we chose the set that yields the lowest sum of χ2 values resulting from the fit of both the light and radial velocity curves. We then imported the particular set as input to a new run of 1000 iterations, having the parameter-kicking option disabled. The mean and standard deviation of the values for each parameter were derived to provide the solution and the 1σ uncertainties, respectively. The above procedure was repeated three times, for each radial velocity set obtained with FASTWIND and the two methods for the O6.5 III spectrum from H05. The final values are presented in Table 5. It appears that the fit using He ii contributes to a separation of the components that is larger by 1 R⊙, compared to the method fitting only on the CNO/He i feature. In addition, complementing the He ii fit with that of C iv yields components of almost equal mass. The systemic velocity modeled with the fit of the synthetic He ii from FASTWIND, is larger by ~20 km s-1 than that modeled with the H05 spectra. The residuals of the three different fits are shown in Tables 3 and 4. We found that the velocity measurements based exclusively on the fit of the CNO/He i blend, yield the best-fit model as can be seen from the resulting rms values of 11 and 8 km s-1 for the radial velocity curves of the primary and the secondary component, respectively. This best-fit model is displayed in Fig. 4.
Physical parameters of D2–EB.
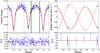 |
Fig. 5 Same as Fig. 4, but for the best-fit parameters inferred using ELC. Uncertainties for the radial velocity measurements correspond to 14 km s-1 for the primary and 10 km s-1 for the secondary component. |
The physical parameters of D2–EB are presented in Table 6. All methods resulted in a surface gravity value for both components of log g ~ 3.9, which is typical for Galactic O-type dwarfs, whereas effective temperatures of 38 kK and 37 kK indicate spectral types of O6.5 and O7, respectively, with a typical uncertainty of half a spectral type (Martins et al. 2005). We adopted a conservative uncertainty of 1kK for the temperatures, equal to the step of the FASTWIND templates used. The inferred light ratio for each method was used to calculate the contribution of the component spectra to the total composite spectrum, as mentioned in Sect. 3. In addition, we derived a negative filling factor F ~ − 1.8 thus supporting the interpretation that both components are unevolved. The measured radii, period and inclination yield synchronous rotational velocities of ~140 and ~130 km s-1, which are in good agreement with those inferred from the fitting process (Sect. 3.1).
Both methods that employ velocities measured from the He ii line yield a total mass that is ~10% higher than the method that discards He ii owing to the larger separation of the components in the observed spectra. This second best-fit method provides measurements of the mass and radius of 24.42 ± 0.15 M⊙ and 9.69 ± 0.07 R⊙ for the primary and 22.06 ± 0.68 M⊙ and 8.87 ± 0.10 R⊙ for the secondary component. The radii measurements correspond to radii of spheres with equal volume to those defined by the WD surface potentials. Compared to the latest updated catalogue of well-studied, detached EBs by Southworth (2014), the primary component of D2–EB is the third most massive star to be studied with a precision better than ~2% and the most precisely determined star with mass ≥14.5 M⊙. Nevertheless, we caution that our 0.6% precision for the mass of the primary is derived as the uncertainty of the solution that optimizes the fit to our observations. Confirming this precision requires more velocity diagnostics and a larger number of observations taken at both quadratures. We hence conclude that the 0.6% precision should be taken with caution. For this reason, a different code than WD was also applied to evaluate the current solution and revise the uncertainties.
We employed the genetic optimizer of ELC (Orosz & Hauschildt 2000) to fit the orbit based on eight input parameters. Specifically, the fit parameters in ELC were HJD0; P; i; the Roche lobe filling factor for each star f, which is the ratio of the radius of the star toward the inner Lagrangian point L1 to the distance to L1 from the center of the star f ≡ xpoint/xL1; Teff2; the primary star’s velocity semi-amplitude K1; and q. In fitting the orbit for D2–EB, ELC computed ~4 × 10⁴ orbits where the values of the eight input parameters varied between fixed ranges judged to be applicable based on the WD fit of the CNO/He i radial velocity set. The subsequent χ2 space was then projected as a function of each orbital and astrophysical parameter of interest in the same way as was done in Williams (2009). From the global  , we estimate 1-σ uncertainties for derived and fitted parameters from the region where
  . These values are listed in Table 6. The inferred masses and radii are 24.5 ± 0.9 M⊙ and 9.2 ± 0.1 R⊙ for the primary and 21.7 ± 0.8 M⊙ and 8.7 ± 0.1 R⊙ for the secondary component. The best-fit model with ELC is displayed in Fig. 5.
The masses derived from the best ELC fit are found to be consistent within uncertainties with those derived by PHOEBE and the WD code. The revised uncertainties of the masses of the primary (3.7%) and the secondary (3.7%) are larger than those from our PHOEBE fit while the values of radii are lower by 2–5% than those derived by the WD code and precise to 1%. This is not surprising, as the radii rely on the well-constrained light curve, while the masses rely more on the sparse radial velocity data set. We adopt the values from the ELC analysis as their uncertainties are more conservative.
5. Distance
A prerequisite to precisely determining independent distances to a double-lined eclipsing system is to fit a spectral energy distribution (SED) to accurate, multi-band photometry taken at a known phase. Baume et al. (2009) conducted wide field UBVIc observations of the complex that hosts the Danks clusters and their surrounding field and obtained point spread function (PSF) photometry of ~35 000 sources including our D2–EB3. The U-band photometry was not available for D2–EB likely because of the high extinction. Using the ephemerides derived by our four methods, we converted the Julian dates of the six per-filter exposures from the Baume et al. (2009) data (G. Carraro, priv. comm.) to units of phase. We supplemented the optical photometry with 2MASS measurements (Cutri et al. 2003) in the J-, H-, Ks-bands obtained on JD 2 451 594.871 34. All observations are consistent within their uncertainties, to out-of-eclipse phases of equal brightness (Figs. 4 and 5). To convert the magnitudes to fluxes, we used zeropoints from Bessell et al. (1998) for the optical photometry and from Cohen et al. (2003) for 2MASS.
Spectral energy distributions in accordance with the physical parameters of the best-fit spectra were generated with FASTWIND, to provide the flux density per surface unit through our studied bands. The composite flux measured at Earth from a binary at a distance d, at a wavelength λ, reddened to extinction A(λ), is given by 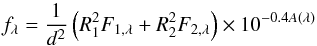 where R1,2 and F1,2 are the radii and the surface fluxes of the components, respectively. The composite SED was reddened according to the new family of optical and near-infrared extinction laws for O-type stars provided by Maíz Apellániz et al. (2014), which constitute an improvement of the widely used extinction laws by Cardelli et al. (1989). We ran a fitting algorithm over a wide range of distances with a step of 0.05 kpc, setting free the monochromatic parameters R5495 and E(4405 − 5495) for the type and amount of extinction, respectively, and the best-fit values were considered to be those that minimized the weighted-χ2. To estimate the uncertainty of our measurements, we used a Monte Carlo approach. In particular, we ran the fitting procedure 1000 times using sets of randomly selected parameters (photometry and radii) within their uncertainties assuming a Gaussian distribution is used. The corresponding values of distance are shown in Table 6 for every set of radii and temperatures determined from the four different fit models. Our adopted radii measured with ELC yielded d = 3.52 ± 0.08 kpc, E(4405 − 5495) = 3.66 ± 0.06 mag, R5495 = 3.26 ± 0.04 and A5495 = 11.9 ± 0.1 mag, based on a photometric Teff2 ~ 36 kK. Assuming a spectroscopic Teff2 = 37 kK, the distance changed slightly to d = 3.55 ± 0.08 kpc. Having three degrees of freedom, the reduced-χ2 of our resulting fits was measured to be
  .
.
We repeated the above procedure setting the amount of extinction E(4405 − 5495) to the value of its band-integrated equivalent E(B − V) (and so increasing the degrees of freedom by one). Specifically, we calculated (B − V)0 = −0.27 mag from the synthetic unreddened model at the isophotal wavelengths, which is in agreement with the intrinsic color of O6-9 giants/dwarfs provided by Martins & Plez (2006), thus yielding E(B − V) = 3.28 ± 0.16 mag. Our best-fit model then yielded d = 3.34 ± 0.12 kpc, though resulting from a fit ( ) that is not as good as that achieved when setting E(4405 − 5495) free. Both reddened SEDs are shown in Fig. 6. Adopting E(4405 − 5495) = 3.66 mag, the residuals indicate a better fit to the JHKs-band photometry and a reasonable fit to the Ic-band photometry. The B-band photometry clearly deviates from our adopted model causing the discrepancy of ~0.4 mag between the two values of the amount of extinction. This could be partly attributed to the uncertainty of the rather faint B-band photometric data (>22 mag). However, it may also leave room for a further improvement of the extinction laws. Indeed, having the B-band photometry excluded from the fit, our procedure yielded d = 3.53 ± 0.08 and
  (with two degrees of freedom), which still deviates from
  . We caution that in the optical, both families of extinction laws by Maíz Apellániz et al. (2014) and Cardelli et al. (1989) have been tested on a sample of low/intermediate reddened stars (E(4405 − 5495) < 1.5 mag). Revision of the optical laws for more optically-obscured targets, combined with a different value of the power law exponent for the near-infrared range, could result in a better fit.
The measured distance to D2–EB is in good agreement with the reported values of distance to the Danks 2 cluster in the literature: 3.7 ± 0.5 kpc (Chené et al. 2012), 3.8 ± 0.6 kpc (Davies et al. 2012), and 3.4 ± 0.2 kpc (Bica et al. 2004). Nevertheless, our inferred, well-constrained physical parameters provide a precision of ~2%, which is a factor of 3–8 improvement compared to the previous studies. Baume et al. (2009) showed that the cluster suffers from substantial reddening with E(B − V) = 2.4 mag (thus yielding AV = 8.7 mag), which might be differential across their studied region. D2–EB resides outside their adopted boundary of Danks 2 and likely coincides with molecular gas that contaminates the northeast of the cluster (Fig. 7), which appears to be the reason for our higher value of A5495 = 11.9 mag. We further examined a Spitzer/GLIMPSE map at 5.8 μm and found emission in the region of the gas.
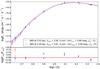 |
Fig. 6 Fit of the reddened, composite SEDs using FASTWIND models to the BVIcJHKs photometry, setting the amount of extinction E(4405 − 5495) as a free parameter (red) and fixed to the value of the observed band-integrated equivalent E(B − V) (blue). The former method provided the best-fit model yielding d = 3.52 ± 0.08 kpc, E(4405 − 5495) = 3.66 ± 0.06 mag, R5495 = 3.26 ± 0.04 and A5495 = 11.9 ± 0.1 mag. |
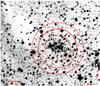 |
Fig. 7 Digitized Sky Survey (DSS-2) map of Danks 2 in the red filter. D2–EB (blue arrow) is located outside the |


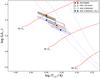 |
Fig. 8 H–R diagram showing the comparison of the parameters of D2–EB modeled with the WD code and our three different sets of radial velocities obtained with the fit of He ii of FASTWIND templates (red circles), the fit of all K-band features of H05 spectra except for the Brγ/He i blend (black triangles), and the fit of the CNO/He i blend of the H05 spectra (green squares). The last set is also modeled with ELC and parameters are shown with blue asterisks. Evolutionary tracks and isochrones for single stars (Ekström et al. 2012) at Z = 0.014 with rotation are shown. Isochrones from left to right correspond to 3.2, 4, and 5 Myr. All methods yield co-evolutionary components with an age of ~3.2 Myr that appear overluminous for their masses. |
6. Discussion
To measure the age of D2–EB and therefore the Danks 2 cluster, we used the evolutionary models of Ekström et al. (2012) for single stars, at Z = 0.014. The models assume initial stellar rotation at 40% of the critical velocity accounting for effects discussed in Meynet & Maeder (2000), and correspond to main sequence velocities of 110 − 220 km s-1, which are suitable for our case. All methods followed to derive masses agree with an age of ~3.2 Myr for both components, according to the Hertzsprung–Russell (H–R) diagram shown in Fig. 8. A by-eye interpolation of the evolutionary tracks implies that the members of D2–EB appear overluminous for their masses. In particular, when He ii is used to measure velocities, the obtained masses found are ~15% lower than those predicted for both components. When excluding He ii from the velocity analysis, this mass discrepancy increases to ~20%. A mass discrepancy is often reported when dealing with contact and semidetached massive binary systems (Burkholder et al. 1997; Bonanos 2009; Koumpia & Bonanos 2012) where one or both components are ovefilling their Roche lobe and is clearly attributed to mass transfer. Nevertheless, in the case of the well-detached D2–EB, we have no evidence for Roche lobe overflow and in addition, both components appear less massive than expected. Similar cases of mass discrepancy in detached systems have also been reported by González et al. (2005), Williams et al. (2008), and most recently by Massey et al. (2012). The latter study concluded that models with enhanced convective overshooting or higher initial rotation should be adopted in order to explain the ~11% mass discrepancy observed in two detached systems in the Large Magellanic Cloud. A recent study by Markova & Puls (2015) showed that a mass discrepancy for Galactic O stars with initial mass <35 M⊙ is evident, with the spectroscopically derived masses being systematically lower than the evolutionary masses inferred from the theoretical models. Stars with spectroscopically measured masses of ~25 M⊙ and ~22 M⊙, equal to our adopted values for the components of D2–EB, were shown to display evolutionary masses of ~30 M⊙ and ~27 M⊙ respectively, which are in a good agreement with our predictions from the theoretical models.
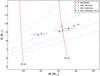 |
Fig. 9 Mass-radius (M–R) diagram showing the comparison of the parameters of D2–EB with evolutionary tracks and isochrones for single stars (Ekström et al. 2012) at Z = 0.014 with rotation. The symbols denoting each method are the same as in Fig. 8. Isochrones from the bottom up, correspond to 3.2, 4, 5, and 6.3 Myr. We find that both methods based on a He ii fit for measuring velocities yield co-evolutionary components of age 4.5 Myr. The best-fit model based on the CNO/ He i blend fit yields an age of ~5 Myr, as modeled with the WD code and with ELC. |
Davies et al. (2012) suggested an age for the cluster of 2 − 6 Myr, based on the presence of the carbon-rich Wolf-Rayet D2–3 and the luminosity of the brightest OB supergiant in Danks 2. Chené et al. (2012) fit theoretical isochrones to a color-magnitude diagram of their near-infrared photometry and argued that Danks 2 is likely older, with an age of 4 − 7 Myr. A temperature-independent method for evaluating the evolutionary status of D2–EB is used in the mass-radius diagram presented in Fig. 9. The two methods based on the fit of He ii are both consistent with an age of 4.5 Myr. Our adopted, best-fit model yields an age of ~5 Myr, following from both the WD code or ELC. All measured values of age are found to be within the range of ages determined for Danks 2 by the previous studies.
D2–EB resides slightly outside the  angular size of Danks 2 (Chené et al. 2012, see Fig. 7; solid and dashed circles) beyond which, the cluster density profile falls below that of the field. The systemic velocity (−7 ± 1 km s-1) is not in agreement with the radial velocity of Danks 2 (−44 ± 8 km s-1, Chené et al. 2012) nor the host G305 complex (−39 ± 3 km s-1, Davies et al. 2012). This suggests that D2–EB may have been ejected from the cluster as a runaway binary. The radial velocity of D2–EB relative to the cluster is 37 ± 8 km s-1. This can be taken as a lower limit for the space velocity at which the system is escaping from the cluster. The angular distance 2.́1 from the center corresponds to a projected linear distance of 2.2 ± 0.1 pc. Assuming a kinematic age ~5 Myr equal to the measured age of the system, the tangential velocity would be less than 1 km s-1.
Blaauw (1961) hypothesized that runaway stars are created when a massive component within a binary system explodes as a Type II supernova. The secondary is then ejected with a velocity comparable to the orbital velocity at the time of the supernova event. The explosion may not disrupt the system (Hills 1983), which will be observed as a OB-neutron star/black-hole system and eventually become a high-mass X-ray binary. Given that D2–EB is a double-lined O-type binary, it is unlikely that such a mechanism took place. Alternatively, D2–EB could have been part of a triple system including a very massive component (≥85 M⊙) with a lifetime of less than 4.5 Myr. However, the inferred radial velocity curve lacks evidence of a low-mass third companion, unless it orbits with a high eccentricity and/or long period. Observations of D2–EB over a longer time span than the data presented here are required to investigate the possibility of a third body in the system. Poveda et al. (1967) suggested that runaway stars are dynamically ejected due to encounters of collapsing protostars in/near the core of young clusters. Interactions in clusters that contain initial hard binaries increase the number of escapees via binary-binary interactions (Mikkola 1983). The less massive binary system reaches peculiar space velocities up to ~200 km s-1, while the more massive system travels at a speed less than ~100 km s-1 (Leonard & Duncan 1988). The binary frequency for runaways with V∞> 30 km s-1 is predicted to be 10% and it is striking that systems hosting components of M ~ 20 M⊙ as the most massive members are not predicted to escape with more than 50 km s-1 (Leonard & Duncan 1990). This does not conflict with the observed lower limit for the space velocity of D2–EB. A young, dense cluster core increases the possibility of dynamical ejection, with the consequence that the kinematic age of the runaways is similar to the age of the cluster (Gualandris et al. 2004). In this case, the unreasonably low estimated value for the tangential velocity of D2–EB makes the possibility of the dynamical ejection through binary-binary interaction unlikely.
7. Conclusions
We present an analysis of new K-band spectra from VLT/ISAAC with which we determined accurate fundamental parameters of D2–EB, a massive, early-type eclipsing binary in the young cluster Danks 2, which is embedded in the G305 Galactic star-forming region. The best-fit model to the binary was obtained by using the He i line (2.112 μm) and the CNO complex for measuring radial velocities. The system was found to contain two co-evolutionary O6.5–7 main-sequence components with an age of ~5 Myr. We determined masses and radii of 24.5 ± 0.9 M⊙ and 9.2 ± 0.1 R⊙ for the primary and 21.7 ± 0.8 M⊙ and 8.7 ± 0.1 R⊙ for the secondary component with a precision of ~3.7% for the masses and ~1% for the radii. Models using a fit of He ii to measure velocities, were found to yield a ~10% higher total mass and ~0.5 Myr younger age.
Employing the precise measurements of the radii and out-of-eclipse optical and near-infrared photometry of D2–EB, we determined a distance to the system of d = 3.52 ± 0.08 kpc from a fit to the SED of the system. To date, this is the most highly constrained distance measurement to the Danks clusters and thus to the host complex, with a precision of ~2%. D2–EB is found to reside slightly outside the cluster and is optically obscured by molecular gas, which causes an extinction for the system of A5495 = 11.9 ± 0.1 mag. We report a systemic velocity for the system that is inconsistent with that of Danks 2, making D2–EB a candidate runaway binary. However, neither of the two main mechanisms thought to yield runaways provides a robust explanation of the nature of the ejection of D2–EB from the Danks 2 cluster. Future proper motion measurements with Gaia5, which will be complete down to 20th mag in the visual, should constrain the motion of both the cluster and the system, and should provide well-determined values of the space velocity and the kinematic age of D2–EB.
Acknowledgments
M.K. and A.Z.B. acknowledge funding by the European Union (European Social Fund), National Resources under the “ARISTEIA” action of the Operational Programme “Education and Lifelong Learning” in Greece. M.K., A.Z.B. and E.K. acknowledge research and travel support from the European Commission Framework Program Seven under the Marie Curie International Reintegration Grant PIRG04-GA-2008-239335. Support for J.L.P. is in part by FONDECYT through the grant 1151445 and by the Ministry of Economy, Development, and Tourisms Millennium Science Initiative through grant IC120009, awarded to The Millennium Institute of Astrophysics, MAS. This publication makes use of data products from the Two Micron All Sky Survey, which is a joint project of the University of Massachusetts and the Infrared Processing and Analysis Center/California Institute of Technology, funded by the National Aeronautics and Space Administration and the National Science Foundation. The Digitized Sky Surveys were produced at the Space Telescope Science Institute under US Government grant NAG W-2166. The images of these surveys are based on photographic data obtained using the Oschin Schmidt Telescope on Palomar Mountain and the UK Schmidt Telescope. The plates were processed into the present compressed digital form with the permission of these institutions. This research has made use of the VizieR catalogue access tool, CDS, Strasbourg, France.
References
- Alard, C. 2000, A&AS, 144, 363 [NASA ADS] [CrossRef] [EDP Sciences] [Google Scholar]
- Alard, C., & Lupton, R. H. 1998, ApJ, 503, 325 [NASA ADS] [CrossRef] [Google Scholar]
- Andersen, J. 1991, A&ARv, 3, 91 [NASA ADS] [CrossRef] [Google Scholar]
- Baume, G., Carraro, G., & Momany, Y. 2009, MNRAS, 398, 221 [NASA ADS] [CrossRef] [Google Scholar]
- Bessell, M. S., Castelli, F., & Plez, B. 1998, A&A, 333, 231 [NASA ADS] [Google Scholar]
- Bica, E., Ortolani, S., Momany, Y., Dutra, C. M., & Barbuy, B. 2004, MNRAS, 352, 226 [NASA ADS] [CrossRef] [Google Scholar]
- Blaauw, A. 1961, Bull. Astron. Inst. Netherlands, 15, 265 [NASA ADS] [Google Scholar]
- Bonanos, A. Z. 2009, ApJ, 691, 407 [NASA ADS] [CrossRef] [Google Scholar]
- Bonanos, A. Z., Stanek, K. Z., Kudritzki, R. P., et al. 2006, ApJ, 652, 313 [NASA ADS] [CrossRef] [Google Scholar]
- Bonanos, A. Z., Castro, N., Macri, L. M., & Kudritzki, R.-P. 2011, ApJ, 729, L9 [NASA ADS] [CrossRef] [Google Scholar]
- Burkholder, V., Massey, P., & Morrell, N. 1997, ApJ, 490, 328 [NASA ADS] [CrossRef] [Google Scholar]
- Cardelli, J. A., Clayton, G. C., & Mathis, J. S. 1989, ApJ, 345, 245 [NASA ADS] [CrossRef] [Google Scholar]
- Caswell, J. L., & Haynes, R. F. 1987, A&A, 171, 261 [NASA ADS] [Google Scholar]
- Chené, A.-N., Borissova, J., Clarke, J. R. A., et al. 2012, A&A, 545, A54 [NASA ADS] [CrossRef] [EDP Sciences] [Google Scholar]
- Chini, R., Hoffmeister, V. H., Nasseri, A., Stahl, O., & Zinnecker, H. 2012, MNRAS, 424, 1925 [NASA ADS] [CrossRef] [Google Scholar]
- Clark, J. S., & Porter, J. M. 2004, A&A, 427, 839 [NASA ADS] [CrossRef] [EDP Sciences] [Google Scholar]
- Cohen, M., Wheaton, W. A., & Megeath, S. T. 2003, AJ, 126, 1090 [NASA ADS] [CrossRef] [Google Scholar]
- Cutri, R. M., Skrutskie, M. F., van Dyk, S., et al. 2003, 2MASS All Sky Catalog of point sources [Google Scholar]
- Danks, A. C., Dennefeld, M., Wamsteker, W., & Shaver, P. A. 1983, A&A, 118, 301 [NASA ADS] [Google Scholar]
- Danks, A. C., Wamsteker, W., Shaver, P. A., & Retallack, D. S. 1984, A&A, 132, 301 [NASA ADS] [Google Scholar]
- Davies, B., Clark, J. S., Trombley, C., et al. 2012, MNRAS, 419, 1871 [NASA ADS] [CrossRef] [Google Scholar]
- Dutra, C. M., Bica, E., Soares, J., & Barbuy, B. 2003, A&A, 400, 533 [NASA ADS] [CrossRef] [EDP Sciences] [Google Scholar]
- Ekström, S., Georgy, C., Eggenberger, P., et al. 2012, A&A, 537, A146 [NASA ADS] [CrossRef] [EDP Sciences] [Google Scholar]
- González, J. F., Ostrov, P., Morrell, N., & Minniti, D. 2005, ApJ, 624, 946 [NASA ADS] [CrossRef] [Google Scholar]
- Gualandris, A., Portegies Zwart, S., & Eggleton, P. P. 2004, MNRAS, 350, 615 [NASA ADS] [CrossRef] [Google Scholar]
- Guinan, E. F., Fitzpatrick, E. L., DeWarf, L. E., et al. 1998, ApJ, 509, L21 [NASA ADS] [CrossRef] [Google Scholar]
- Hanson, M. M., Conti, P. S., & Rieke, M. J. 1996, ApJS, 107, 281 [Google Scholar]
- Hanson, M. M., Kudritzki, R.-P., Kenworthy, M. A., Puls, J., & Tokunaga, A. T. 2005, ApJS, 161, 154 [NASA ADS] [CrossRef] [EDP Sciences] [MathSciNet] [Google Scholar]
- Hilditch, R. W., Howarth, I. D., & Harries, T. J. 2005, MNRAS, 357, 304 [NASA ADS] [CrossRef] [Google Scholar]
- Hills, J. G. 1983, ApJ, 267, 322 [NASA ADS] [CrossRef] [Google Scholar]
- Koumpia, E., & Bonanos, A. Z. 2012, A&A, 547, A30 [NASA ADS] [CrossRef] [EDP Sciences] [Google Scholar]
- Kourniotis, M., Bonanos, A. Z., Soszyński, I., et al. 2014, A&A, 562, A125 [NASA ADS] [CrossRef] [EDP Sciences] [Google Scholar]
- Lenorzer, A., Mokiem, M. R., de Koter, A., & Puls, J. 2004, A&A, 422, 275 [NASA ADS] [CrossRef] [EDP Sciences] [Google Scholar]
- Leonard, P. J. T., & Duncan, M. J. 1988, AJ, 96, 222 [NASA ADS] [CrossRef] [Google Scholar]
- Leonard, P. J. T., & Duncan, M. J. 1990, AJ, 99, 608 [NASA ADS] [CrossRef] [Google Scholar]
- Maíz Apellániz, J., Evans, C. J., Barbá, R. H., et al. 2014, A&A, 564, A63 [NASA ADS] [CrossRef] [EDP Sciences] [Google Scholar]
- Markova, N., & Puls, J. 2015, in IAU Symp., 307, 117 [Google Scholar]
- Martins, F., & Plez, B. 2006, A&A, 457, 637 [NASA ADS] [CrossRef] [EDP Sciences] [Google Scholar]
- Martins, F., Schaerer, D., & Hillier, D. J. 2005, A&A, 436, 1049 [NASA ADS] [CrossRef] [EDP Sciences] [Google Scholar]
- Massey, P., Morrell, N. I., Neugent, K. F., et al. 2012, ApJ, 748, 96 [NASA ADS] [CrossRef] [Google Scholar]
- Meynet, G., & Maeder, A. 2000, A&A, 361, 101 [NASA ADS] [Google Scholar]
- Mikkola, S. 1983, MNRAS, 203, 1107 [NASA ADS] [CrossRef] [Google Scholar]
- Moorwood, A., Cuby, J.-G., Biereichel, P., et al. 1998, The Messenger, 94, 7 [NASA ADS] [Google Scholar]
- Orosz, J. A., & Hauschildt, P. H. 2000, A&A, 364, 265 [NASA ADS] [Google Scholar]
- Pietrzyński, G., Gieren, W., Graczyk, D., et al. 2013, in IAU Symp. 289, ed. R. de Grijs, 169 [Google Scholar]
- Poveda, A., Ruiz, J., & Allen, C. 1967, Boletin de los Observatorios Tonantzintla y Tacubaya, 4, 86 [Google Scholar]
- Prša, A., & Zwitter, T. 2005, ApJ, 628, 426 [NASA ADS] [CrossRef] [Google Scholar]
- Puls, J., Urbaneja, M. A., Venero, R., et al. 2005, A&A, 435, 669 [NASA ADS] [CrossRef] [EDP Sciences] [Google Scholar]
- Ribas, I., Jordi, C., Vilardell, F., et al. 2005, ApJ, 635, L37 [NASA ADS] [CrossRef] [Google Scholar]
- Rossiter, R. A. 1924, ApJ, 60, 15 [NASA ADS] [CrossRef] [Google Scholar]
- Rousselot, P., Lidman, C., Cuby, J.-G., Moreels, G., & Monnet, G. 2000, A&A, 354, 1134 [NASA ADS] [Google Scholar]
- Sana, H., de Mink, S. E., de Koter, A., et al. 2012, Science, 337, 444 [Google Scholar]
- Santolaya-Rey, A. E., Puls, J., & Herrero, A. 1997, A&A, 323, 488 [NASA ADS] [Google Scholar]
- Schwarzenberg-Czerny, A. 1989, MNRAS, 241, 153 [NASA ADS] [CrossRef] [Google Scholar]
- Simón-Díaz, S., Herrero, A., Sabín-Sanjulián, C., et al. 2014, A&A, 570, L6 [NASA ADS] [CrossRef] [EDP Sciences] [Google Scholar]
- Smette, A., Sana, H., Noll, S., et al. 2015, A&A, 576, A77 [NASA ADS] [CrossRef] [EDP Sciences] [Google Scholar]
- Sota, A., Maíz Apellániz, J., Morrell, N. I., et al. 2014, ApJS, 211, 10 [NASA ADS] [CrossRef] [Google Scholar]
- Southworth, J. 2014, ArXiv e-prints [arXiv:1411.1219] [Google Scholar]
- Southworth, J., & Clausen, J. V. 2006, Ap&SS, 304, 199 [NASA ADS] [CrossRef] [Google Scholar]
- Torres, G., Andersen, J., & Giménez, A. 2010, A&ARv, 18, 67 [Google Scholar]
- van Dokkum, P. G. 2001, PASP, 113, 1420 [NASA ADS] [CrossRef] [Google Scholar]
- van Hamme, W. 1993, AJ, 106, 2096 [NASA ADS] [CrossRef] [Google Scholar]
- Williams, S. J. 2009, AJ, 137, 3222 [NASA ADS] [CrossRef] [Google Scholar]
- Williams, S. J., Gies, D. R., Henry, T. J., et al. 2008, ApJ, 682, 492 [NASA ADS] [CrossRef] [Google Scholar]
- Wilson, R. E., & Devinney, E. J. 1971, ApJ, 166, 605 [NASA ADS] [CrossRef] [Google Scholar]
All Tables
All Figures
|
Fig. 1 Reduced-χ2 panel of the fit of composite FASTWIND spectra to the ISAAC spectrum of HJD 2 456 345.856 71. Axes denote the effective temperature of the components and are split into six equal intervals with 16 subdivisions of 10 km s-1 each to represent the projected rotational velocity range 50 − 200 km s-1. We find that the best fit corresponds to a pair of templates with Teff1 = 38 kK, Teff2 = 37 kK, and vsini values of 150 ± 20 and 130 ± 20 km s-1, respectively. |
| In the text | |
|
Fig. 2 Normalized ISAAC spectra (blue) sorted by the orbital phase (φ) of D2–EB, including the Brγ (2.166 μm)/He i (2.162 μm) blend and the He ii (2.189 μm) line. The composite spectra (red) of two FASTWIND templates of 38 kK and 37 kK, weighted, summed, and shifted to our derived velocities, are overplotted. The best-fit velocites are obtained from the fit of He ii. For clarity, a smoothing window is applied to the observed spectra and a constant is added to the relative fluxes. Absorption features in the wavelength range 2.170 − 2.185μm are due to poor telluric correction. |
| In the text | |
|
Fig. 3 Same as in Fig. 2, but the composite spectrum comprises two O6.5 III spectra taken from Hanson et al. (2005). In the left panel, we show the entire wavelength range of the ISAAC spectra, which includes lines of C iv (2.08 μm), He i (2.113, 2.162 μm), the CNO complex (2.115 μm), Brγ (2.166 μm), and He ii (2.189 μm). The best-fit velocities are measured by fitting all features except for the Brγ/He i blend. In the right panel, we show the result of the separate fit to the CNO/He i blend, which was employed to derive velocities. |
| In the text | |
|
Fig. 4 Left panel: Ic-band light curve of D2–EB, phased to the best-fit parameters derived with PHOEBE using spectra from the H05 atlas. Radial velocities were inferred from the fit of the CNO/He i blend. Right panel: radial velocity measurements overplotted by the modeled curve. The solid line denotes the primary component and the dashed line the secondary. Uncertainties correspond to the rms of the best fit, i.e. 11 km s-1 for the primary and 8 km s-1 for the secondary. Green solid lines represent the two observation dates of the BVIc photometry by Baume et al. (2009; six per filter), while the black dashed line indicates the date of the 2MASS measurements. Residuals of the fits are shown in the lower panels. |
| In the text | |
|
Fig. 5 Same as Fig. 4, but for the best-fit parameters inferred using ELC. Uncertainties for the radial velocity measurements correspond to 14 km s-1 for the primary and 10 km s-1 for the secondary component. |
| In the text | |
|
Fig. 6 Fit of the reddened, composite SEDs using FASTWIND models to the BVIcJHKs photometry, setting the amount of extinction E(4405 − 5495) as a free parameter (red) and fixed to the value of the observed band-integrated equivalent E(B − V) (blue). The former method provided the best-fit model yielding d = 3.52 ± 0.08 kpc, E(4405 − 5495) = 3.66 ± 0.06 mag, R5495 = 3.26 ± 0.04 and A5495 = 11.9 ± 0.1 mag. |
| In the text | |
|
Fig. 7 Digitized Sky Survey (DSS-2) map of Danks 2 in the red filter. D2–EB (blue arrow) is located outside the |
| In the text | |
|
Fig. 8 H–R diagram showing the comparison of the parameters of D2–EB modeled with the WD code and our three different sets of radial velocities obtained with the fit of He ii of FASTWIND templates (red circles), the fit of all K-band features of H05 spectra except for the Brγ/He i blend (black triangles), and the fit of the CNO/He i blend of the H05 spectra (green squares). The last set is also modeled with ELC and parameters are shown with blue asterisks. Evolutionary tracks and isochrones for single stars (Ekström et al. 2012) at Z = 0.014 with rotation are shown. Isochrones from left to right correspond to 3.2, 4, and 5 Myr. All methods yield co-evolutionary components with an age of ~3.2 Myr that appear overluminous for their masses. |
| In the text | |
|
Fig. 9 Mass-radius (M–R) diagram showing the comparison of the parameters of D2–EB with evolutionary tracks and isochrones for single stars (Ekström et al. 2012) at Z = 0.014 with rotation. The symbols denoting each method are the same as in Fig. 8. Isochrones from the bottom up, correspond to 3.2, 4, 5, and 6.3 Myr. We find that both methods based on a He ii fit for measuring velocities yield co-evolutionary components of age 4.5 Myr. The best-fit model based on the CNO/ He i blend fit yields an age of ~5 Myr, as modeled with the WD code and with ELC. |
| In the text | |
Current usage metrics show cumulative count of Article Views (full-text article views including HTML views, PDF and ePub downloads, according to the available data) and Abstracts Views on Vision4Press platform.
Data correspond to usage on the plateform after 2015. The current usage metrics is available 48-96 hours after online publication and is updated daily on week days.
Initial download of the metrics may take a while.