Fig. 4
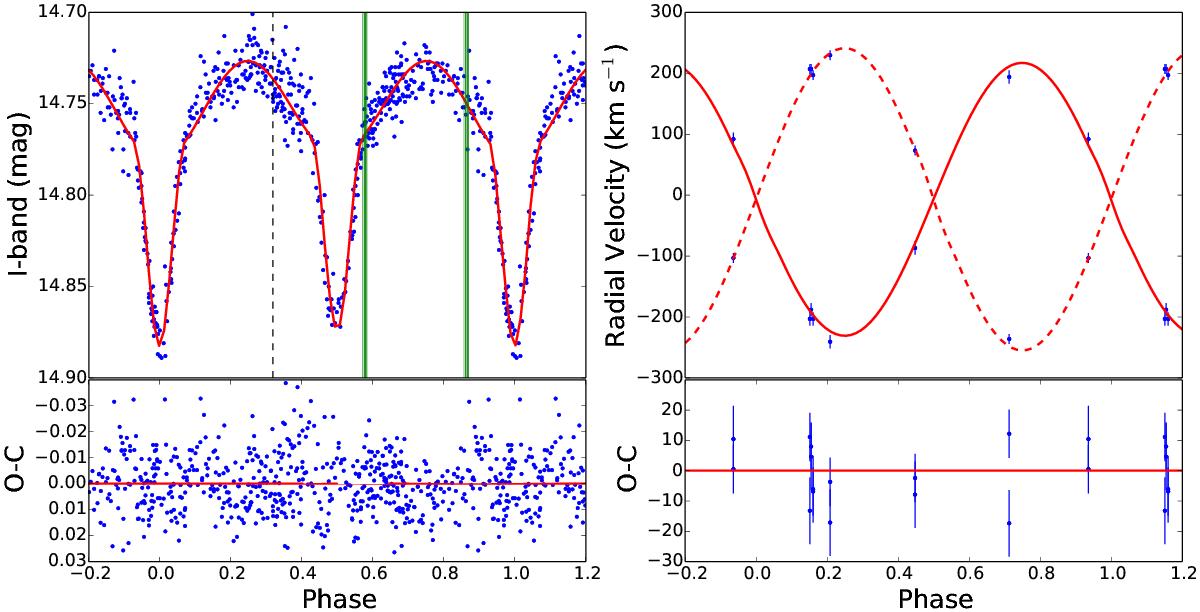
Left panel: Ic-band light curve of D2–EB, phased to the best-fit parameters derived with PHOEBE using spectra from the H05 atlas. Radial velocities were inferred from the fit of the CNO/He i blend. Right panel: radial velocity measurements overplotted by the modeled curve. The solid line denotes the primary component and the dashed line the secondary. Uncertainties correspond to the rms of the best fit, i.e. 11 km s-1 for the primary and 8 km s-1 for the secondary. Green solid lines represent the two observation dates of the BVIc photometry by Baume et al. (2009; six per filter), while the black dashed line indicates the date of the 2MASS measurements. Residuals of the fits are shown in the lower panels.
Current usage metrics show cumulative count of Article Views (full-text article views including HTML views, PDF and ePub downloads, according to the available data) and Abstracts Views on Vision4Press platform.
Data correspond to usage on the plateform after 2015. The current usage metrics is available 48-96 hours after online publication and is updated daily on week days.
Initial download of the metrics may take a while.