Fig. 3
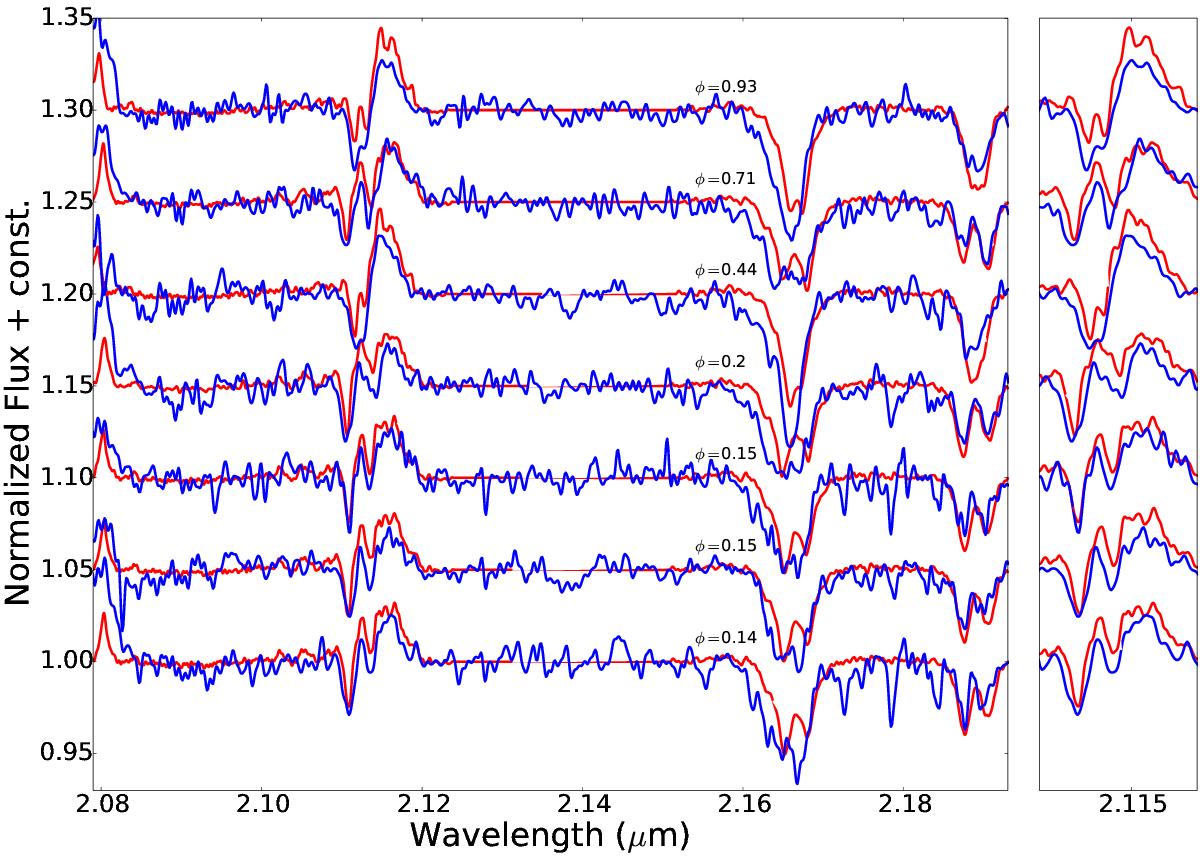
Same as in Fig. 2, but the composite spectrum comprises two O6.5 III spectra taken from Hanson et al. (2005). In the left panel, we show the entire wavelength range of the ISAAC spectra, which includes lines of C iv (2.08 μm), He i (2.113, 2.162 μm), the CNO complex (2.115 μm), Brγ (2.166 μm), and He ii (2.189 μm). The best-fit velocities are measured by fitting all features except for the Brγ/He i blend. In the right panel, we show the result of the separate fit to the CNO/He i blend, which was employed to derive velocities.
Current usage metrics show cumulative count of Article Views (full-text article views including HTML views, PDF and ePub downloads, according to the available data) and Abstracts Views on Vision4Press platform.
Data correspond to usage on the plateform after 2015. The current usage metrics is available 48-96 hours after online publication and is updated daily on week days.
Initial download of the metrics may take a while.