Fig. 9
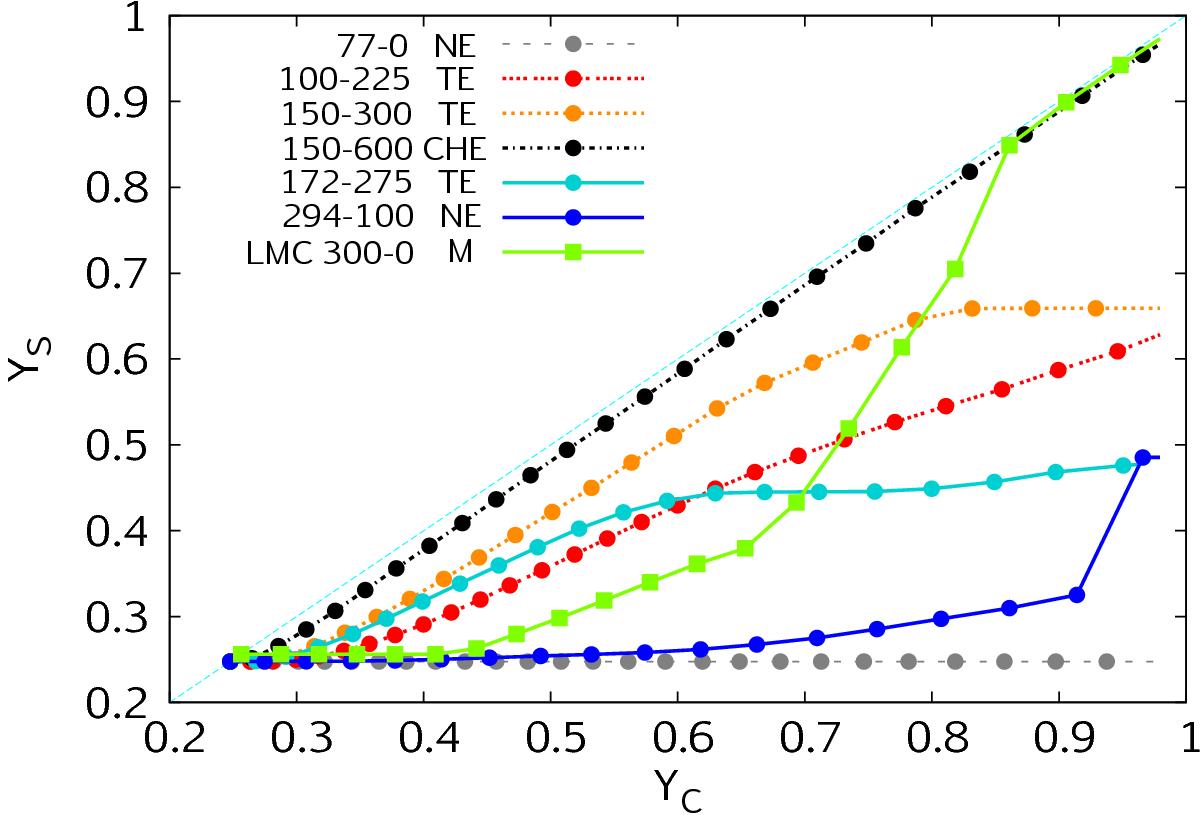
Mass fraction of helium at the stellar surface (YS) as a function of that in the core (YC) for sequences of different initial masses and rotational velocities as indicated by the legend, in units of M⊙−km s-1. Dots mark every 105 years of the evolution. The diagonal line (YC = YS) is marked by a lightblue (dashed) line. Stars that evolve chemically-homogeneously (CHE) lie close to the diagonal, while those that undergo normal evolution (NE) trace a horizontal line; stars with transitionary evolution (TE) lie between (see also Fig. 3). One non-rotating sequence (of type M) with Mini = 300 M⊙ from the LMC grid of Köhler et al. (2015) is shown for comparison.
Current usage metrics show cumulative count of Article Views (full-text article views including HTML views, PDF and ePub downloads, according to the available data) and Abstracts Views on Vision4Press platform.
Data correspond to usage on the plateform after 2015. The current usage metrics is available 48-96 hours after online publication and is updated daily on week days.
Initial download of the metrics may take a while.