Fig. 8
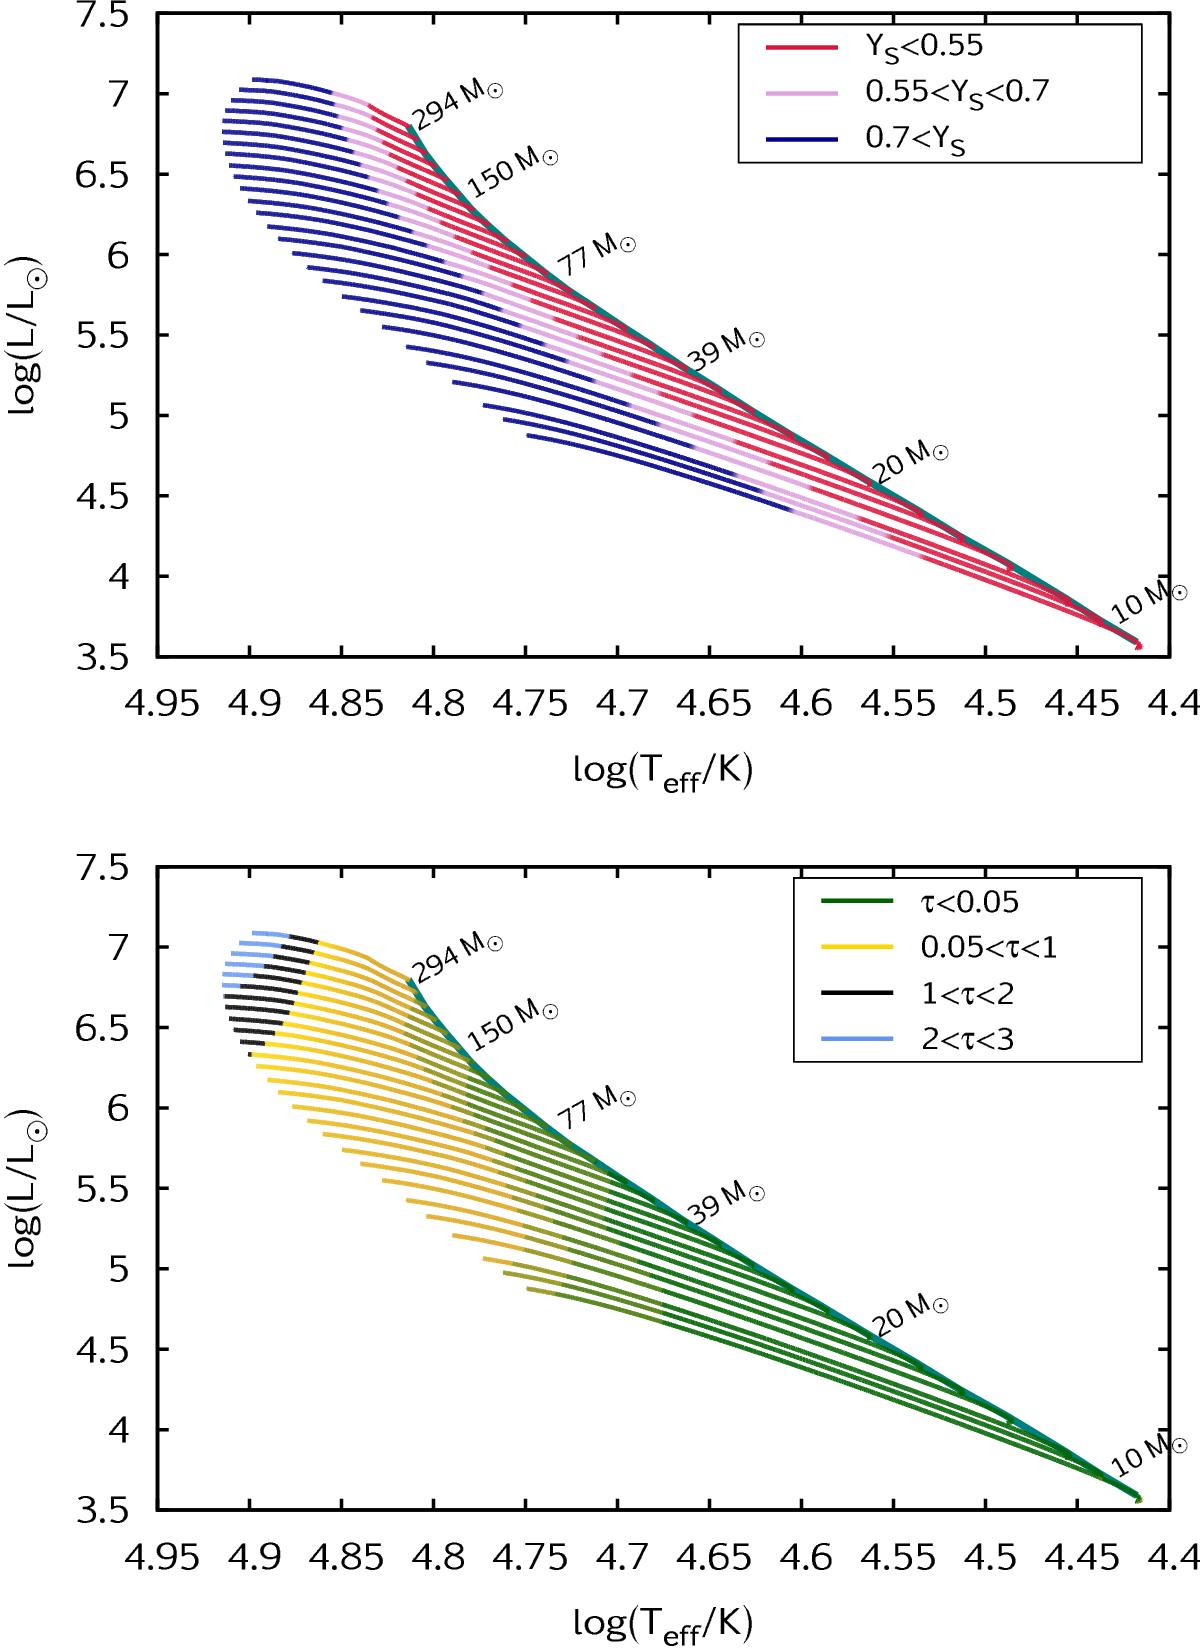
Top: HR diagram of models with vini = 500 km s-1 (chemically-homogeneous evolution) and masses between 9−294 M⊙. The thick green line marks the ZAMS. The colouring marks the surface helium mass fraction as indicated by the legend. For YS< 0.55, OB-type mass-loss is applied; for YS between 0.55 and 0.7, an interpolation between OB- and WR-type mass-loss is applied; and for YS> 0.7, WR-type mass-loss is applied (cf. Sect. 2.3). Bottom: HR diagram of the same collection of models as above. The colouring marks the wind optical depth τ according to Eq. (1).
Current usage metrics show cumulative count of Article Views (full-text article views including HTML views, PDF and ePub downloads, according to the available data) and Abstracts Views on Vision4Press platform.
Data correspond to usage on the plateform after 2015. The current usage metrics is available 48-96 hours after online publication and is updated daily on week days.
Initial download of the metrics may take a while.