Fig. 5
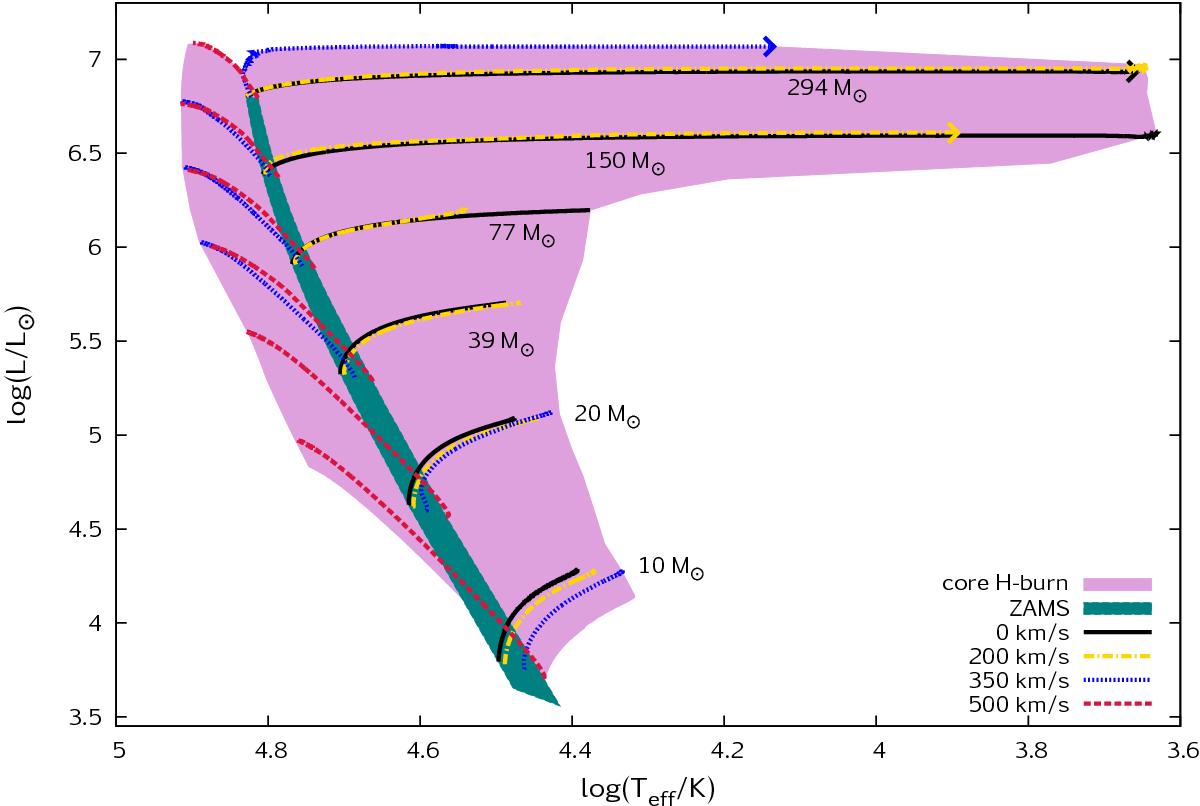
Evolutionary tracks in the HR diagram during core hydrogen burning for models with initial masses between 9−300 M⊙ (see labels) and initial rotational velocities of 0, 200, 350 and 500 km s-1, with a composition of 1/10 ZSMC. The lighter (purple) shading identifies the region in which all models of our grid undergo core hydrogen burning. The darker (green) shading identifies the zero-age main-sequence. An arrow marks the end of the tracks for models that were stopped before the terminal age main-sequence was reached. Core-hydrogen-burning objects are expected to be found on both sides of the ZAMS, inside the purple coloured region.
Current usage metrics show cumulative count of Article Views (full-text article views including HTML views, PDF and ePub downloads, according to the available data) and Abstracts Views on Vision4Press platform.
Data correspond to usage on the plateform after 2015. The current usage metrics is available 48-96 hours after online publication and is updated daily on week days.
Initial download of the metrics may take a while.