Fig. 3
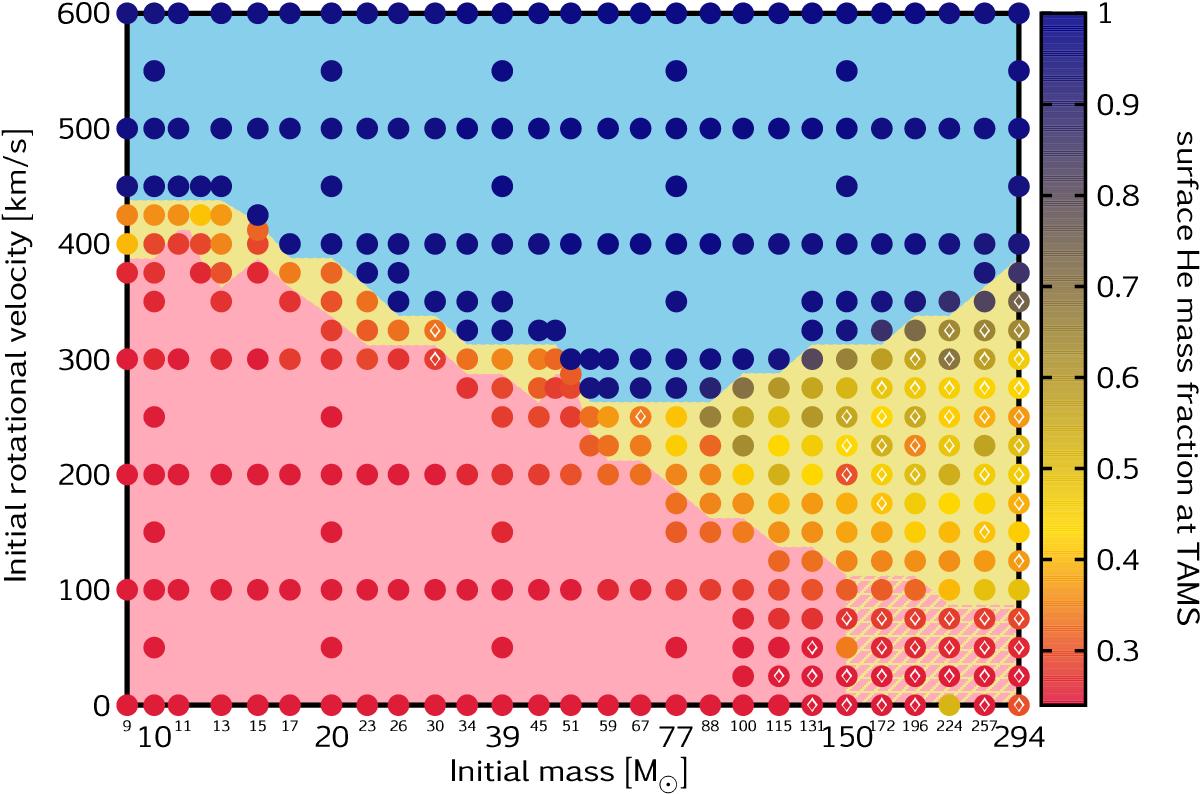
Grid of 375 evolutionary sequences of single stars. Each evolutionary sequence of our grid is represented by one dot in this diagram. Sequences inside the blue shaded region follow chemically-homogeneous evolutionary paths evolving bluewards in the HR diagram and having a surface helium abundance of YS ≃ 0.98 at the TAMS. Sequences inside the red region follow normal evolution, keeping YS close to the initial value of ≃0.24. Sequences inside the yellow region deviate from normal evolution: either they start their lives evolving chemically homogeneously and then switch to normal evolution, or they start normal evolution and mass-loss uncovers their helium-rich layers (cf. Sect. 7). Diamonds mark the sequences that have not reached the TAMS (i.e. the calculation was stopped between 0.82 <YC< 0.98), and the yellow-dashed pattern indicates that the separation line between the red and yellow regions is uncertain at the highest masses.
Current usage metrics show cumulative count of Article Views (full-text article views including HTML views, PDF and ePub downloads, according to the available data) and Abstracts Views on Vision4Press platform.
Data correspond to usage on the plateform after 2015. The current usage metrics is available 48-96 hours after online publication and is updated daily on week days.
Initial download of the metrics may take a while.