Fig. 21
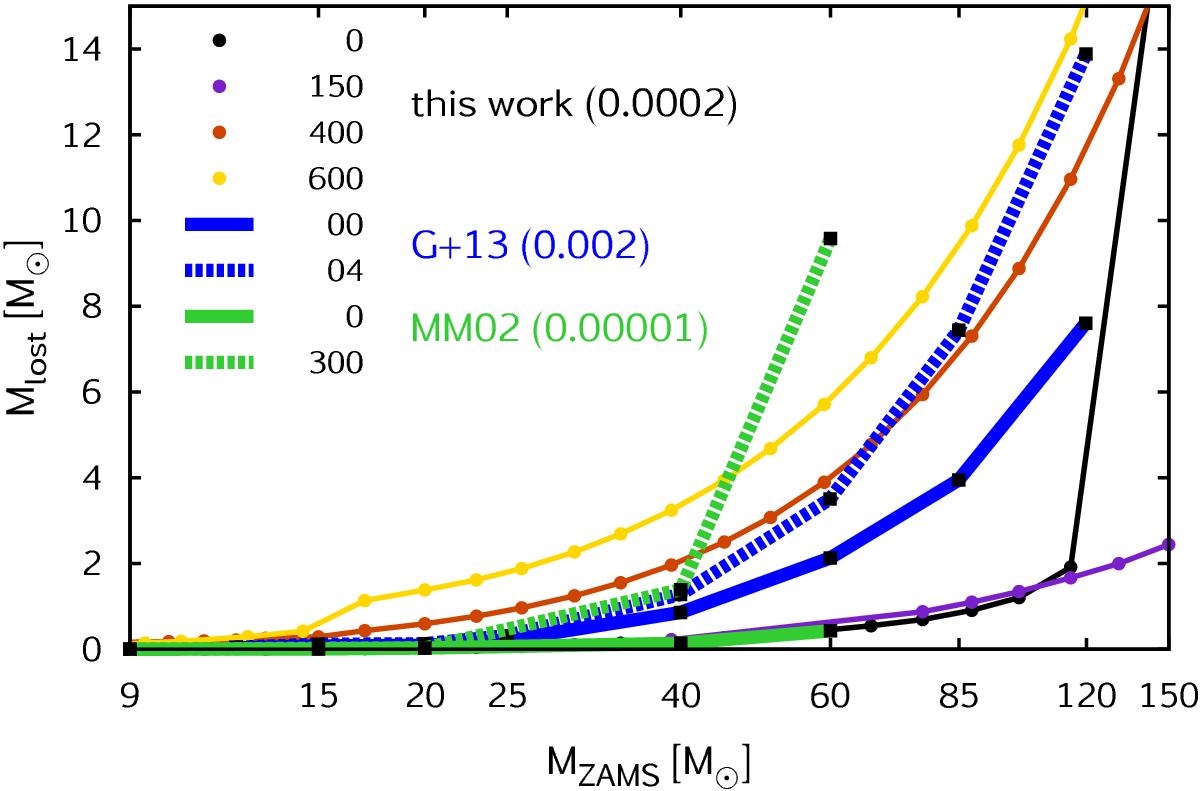
Mass lost during the evolution of the stellar sequences in the three grids with different initial compositions. Sequences with four initial rotational rates of our grid, as indicated by the legend with units in km s-1, are shown by connected dots. Sequences of the Z = 0.002 grid (Georgy et al. 2013) and the Z = 0.00001 grid (Meynet & Maeder 2002) are shown by black rectangles connected with lines as indicated by the legend with units in vk and km s-1, respectively. Note that the Mlost values of the Z = 0.00001 grids correspond to the end of the helium-burning phase and are, therefore, an overestimate of the mass lost during the main sequence. The Mlost values of the Z = 0.002 and I Zw 18 grids correspond to the end of the main sequence.
Current usage metrics show cumulative count of Article Views (full-text article views including HTML views, PDF and ePub downloads, according to the available data) and Abstracts Views on Vision4Press platform.
Data correspond to usage on the plateform after 2015. The current usage metrics is available 48-96 hours after online publication and is updated daily on week days.
Initial download of the metrics may take a while.