Fig. 20
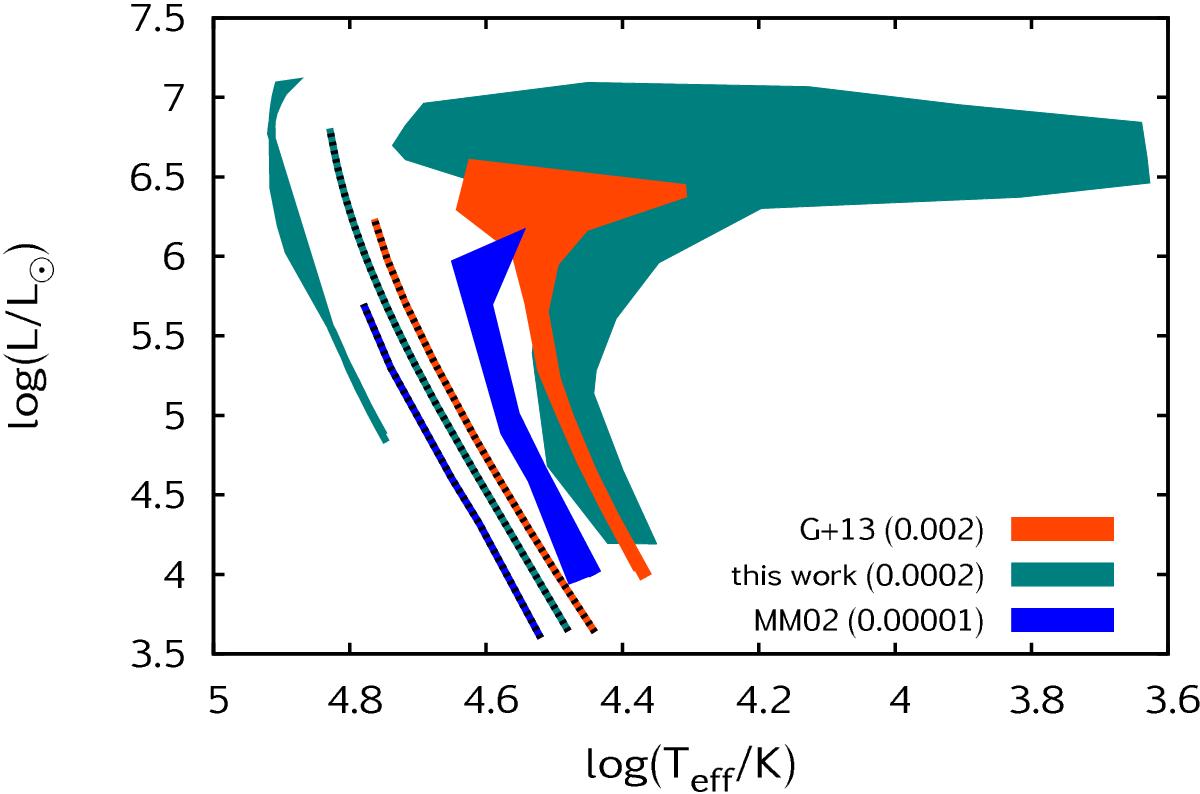
HR diagram showing where the stellar sequences of three different grids begin the main-sequence evolution (ZAMS, marked with black dashed lines) and where they finish the main-sequence evolution (TAMS, shaded regions). G+13: Georgy et al. (2013); MM02: Meynet & Maeder (2002); the initial metallicity of the grids is also indicated by the legend.
Current usage metrics show cumulative count of Article Views (full-text article views including HTML views, PDF and ePub downloads, according to the available data) and Abstracts Views on Vision4Press platform.
Data correspond to usage on the plateform after 2015. The current usage metrics is available 48-96 hours after online publication and is updated daily on week days.
Initial download of the metrics may take a while.